radicalcartography : Slavery
▻http://www.radicalcartography.net/index.html?slavery
 http://www.radicalcartography.net/slavery1790_sm.png
  http://www.radicalcartography.net/slavery1850_sm.png
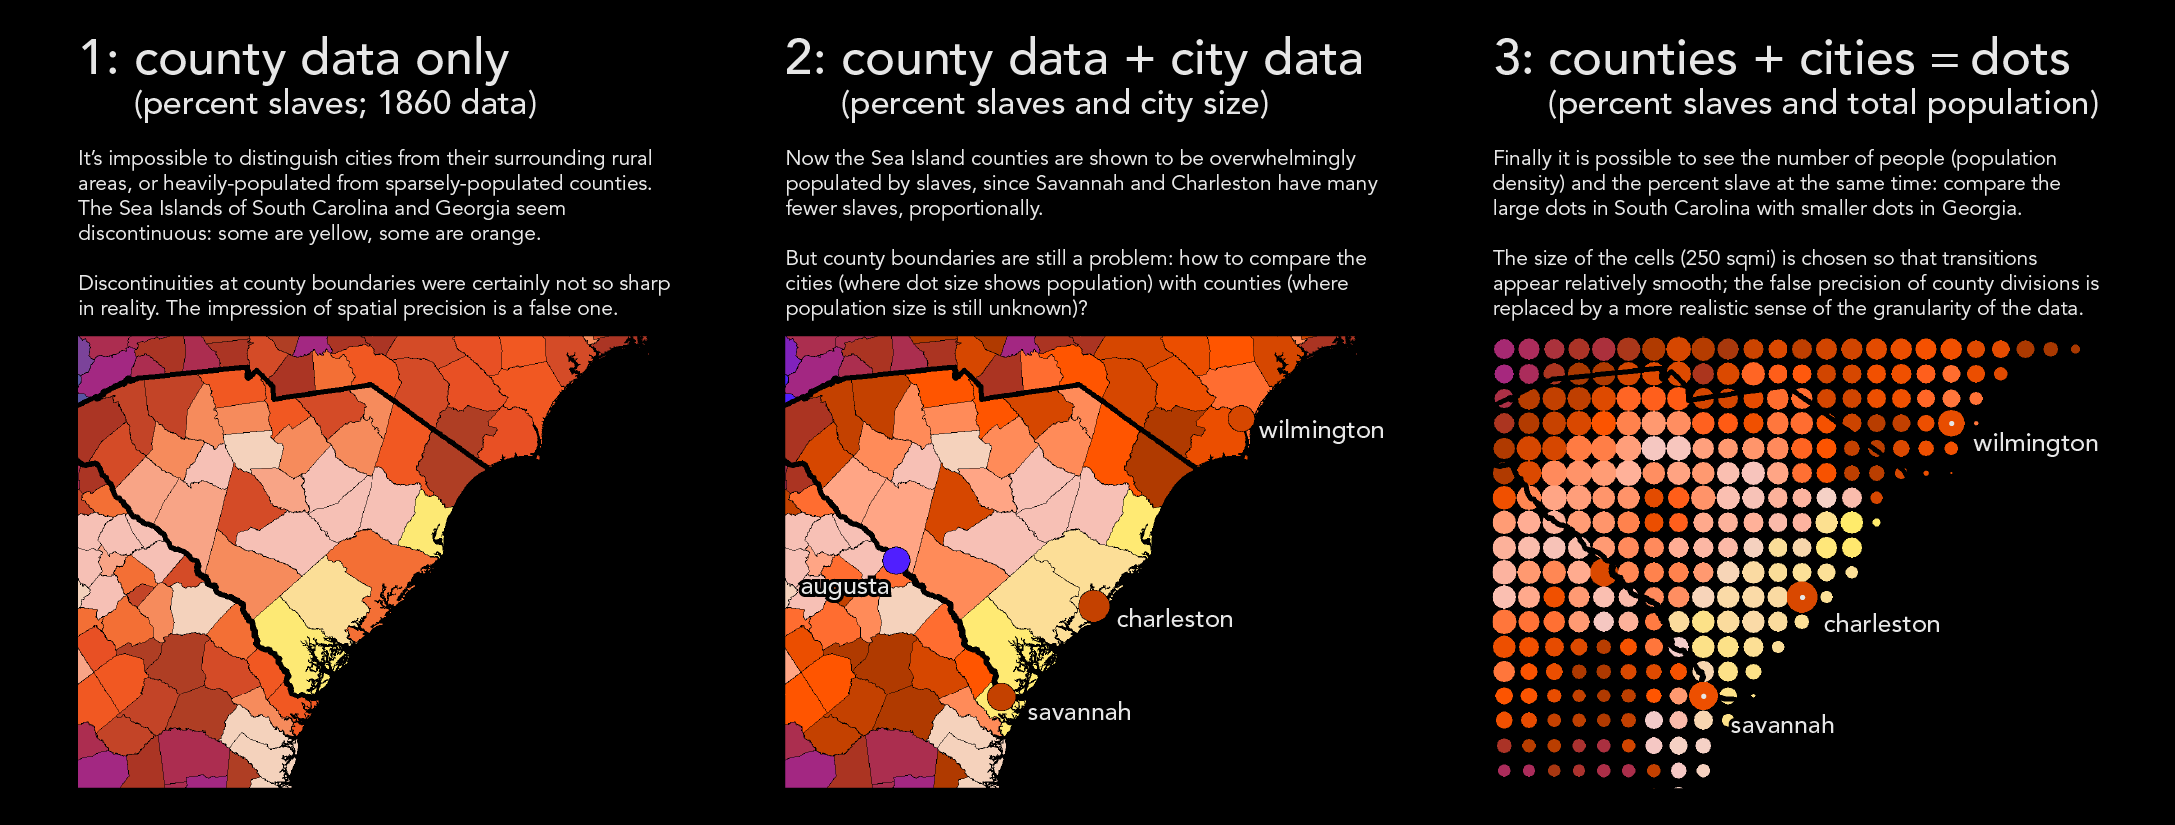
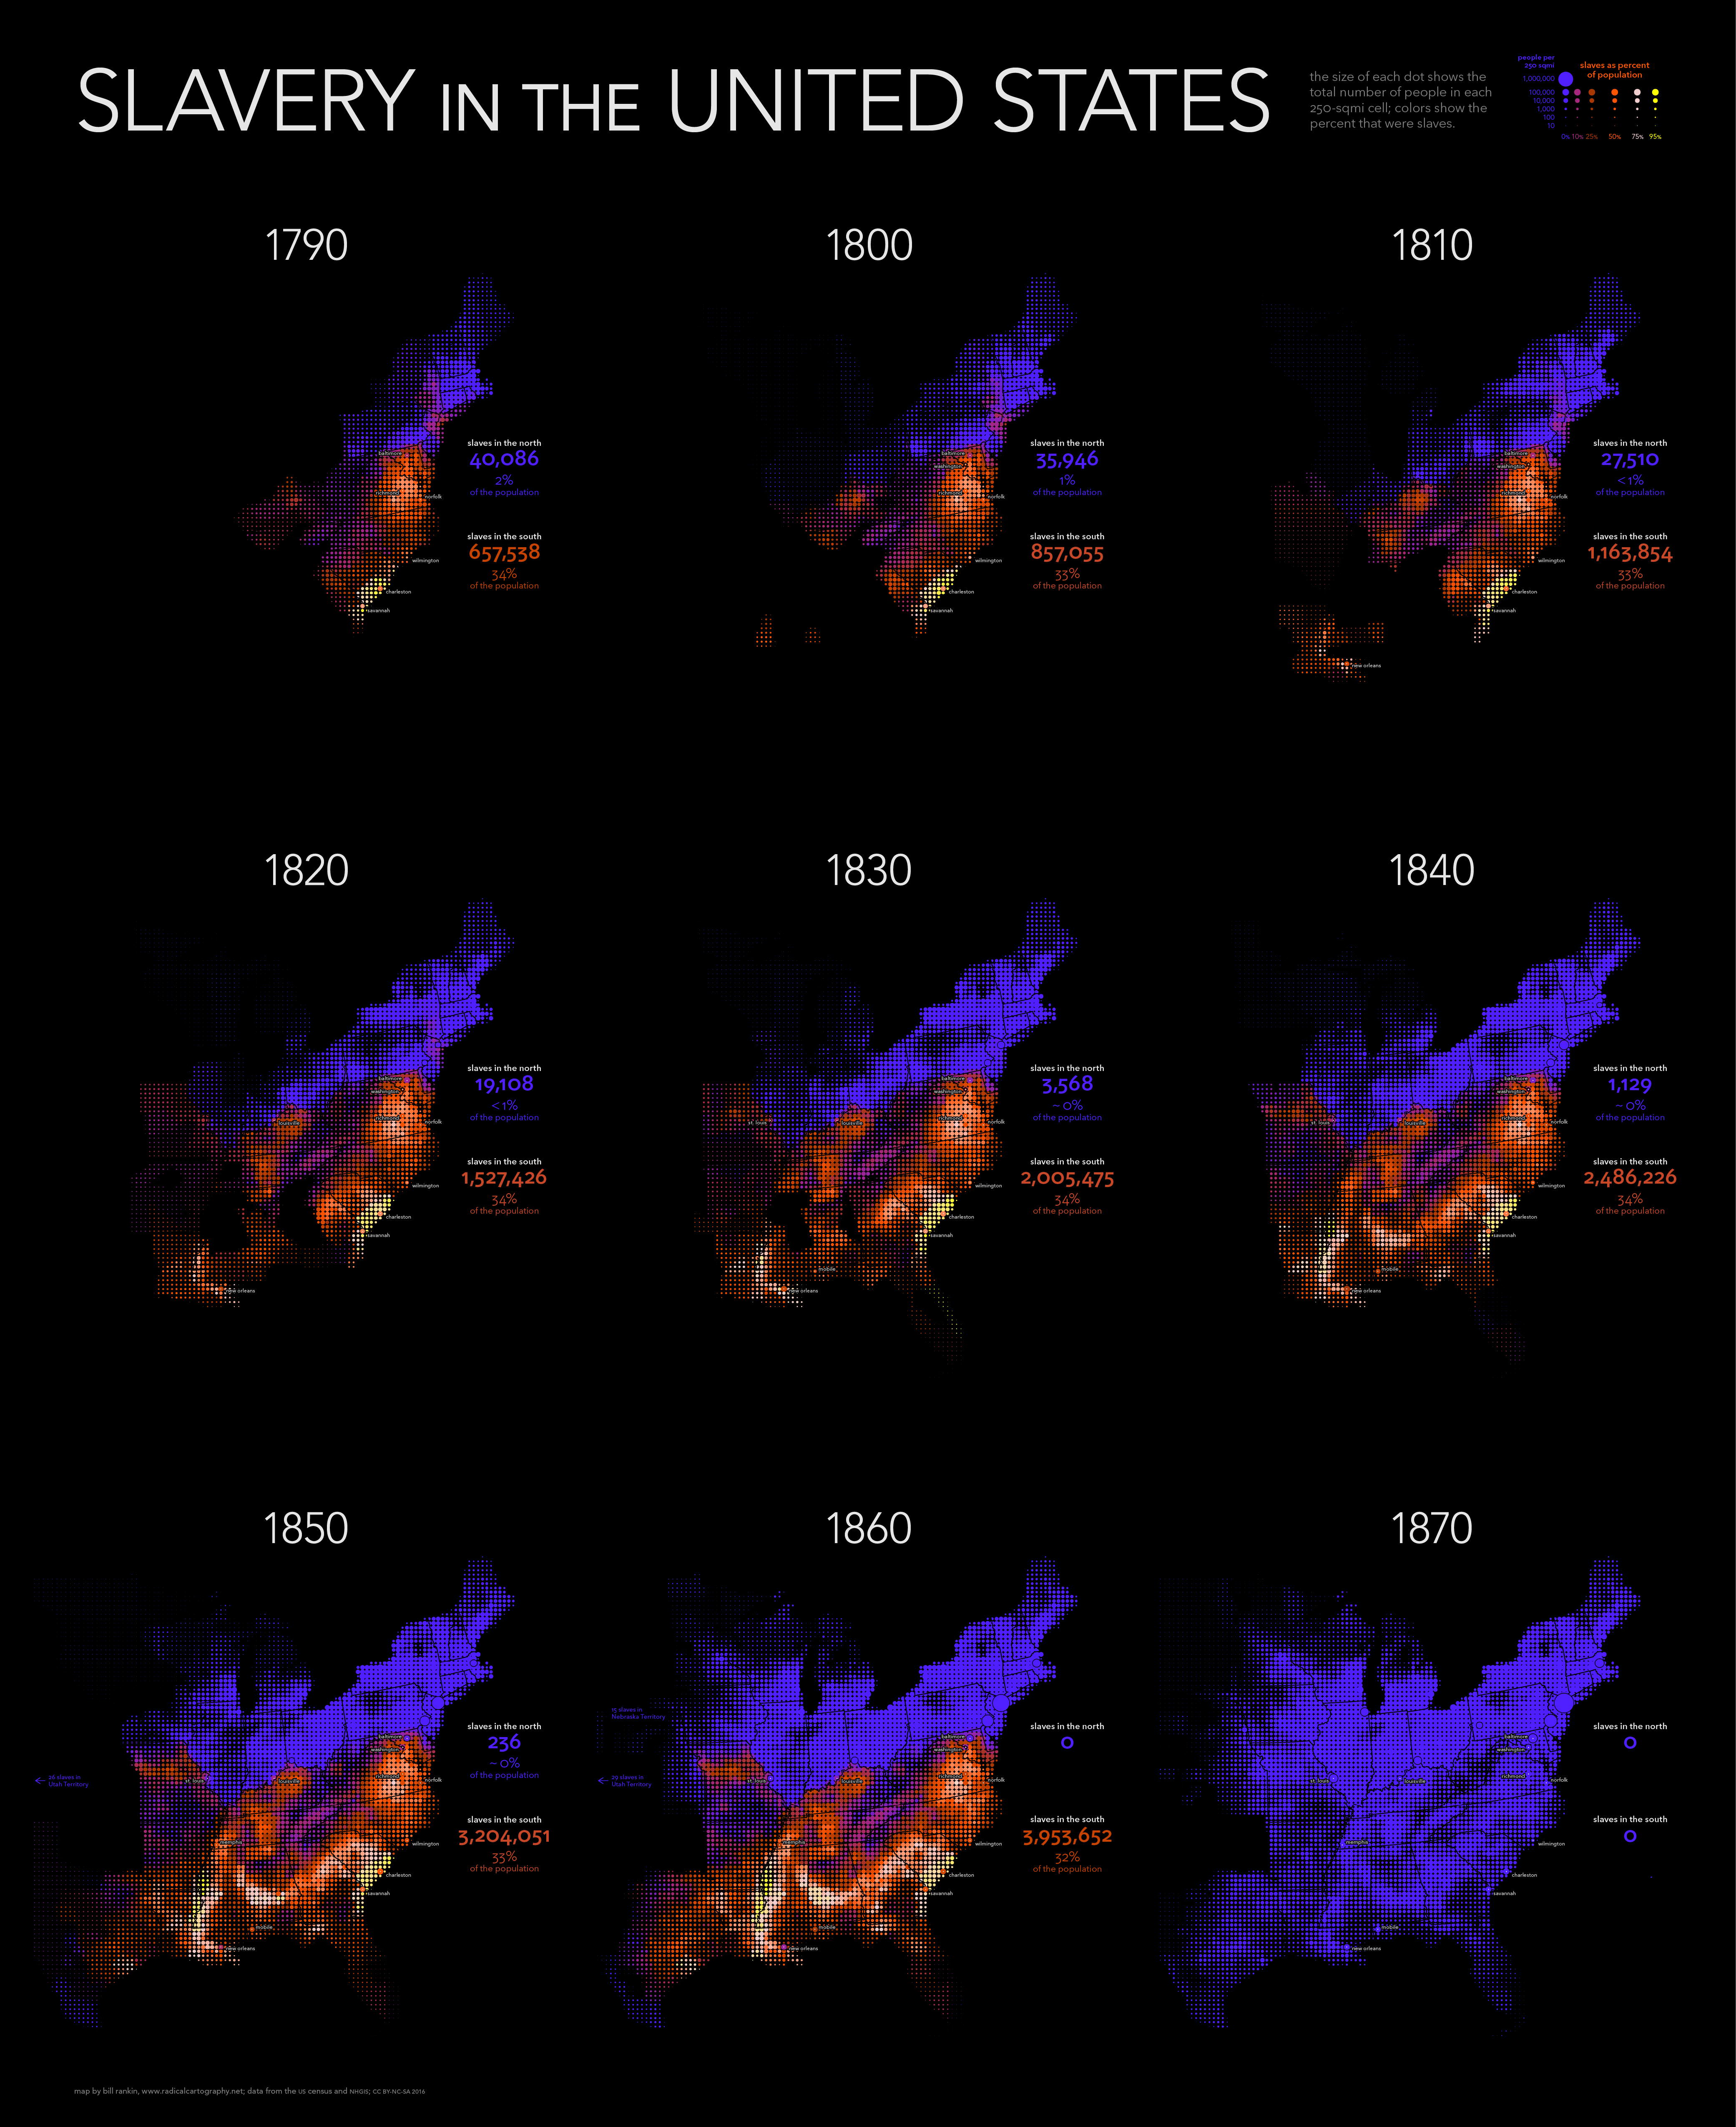
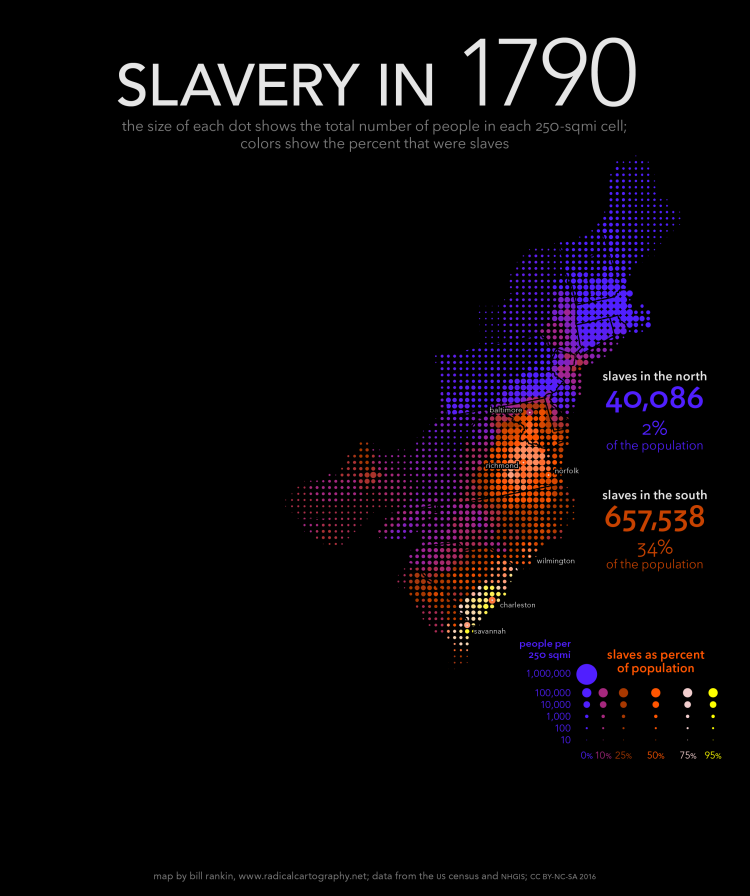
 The size of each dot shows the total population in each 250-sqmi cell, and the color shows the percent that were slaves. But just as important, I’ve also combined the usual county data with historical data for more than 150 cities and towns. Cities usually had fewer slaves, proportionally, than their surrounding counties, but this is invisible on standard maps. Adding this data shows the overwhelming predominance of slaves along the South Carolina coast, in contrast to Charleston; it also shows how distinctive New Orleans was from other southern cities. These techniques don’t solve all problems (especially in sparsely populated areas), but they substantially refocus the visual argument of the maps — away from arbitrary jurisdictions and toward human beings.
#implantation_humaine #esclavage #histoire #visualisation #cartographie
et le #making-of :