


Samuel Granados
▻http://cargocollective.com/samuelgranados
Journalist born in Spain and educated at the Density Design Lab of Politecnico of Milan in Italy, I work now as the head of print infographics at “La Nación” (the second largest news company in Argentina) supervising a team of six graphics editors and represent the department within the newsroom. I also regularly collaborate with “Il Corriere della Sera” in Italy, “Courrier International,” in France, and “Mongolia” in Spain among others. Previously I worked for Público (Spain) and El Mundo (Spain) as a graphic editor for print and online respectively.
Découvert par l’intermédiaire de @cdb_77 à l’occasion de ▻http://seenthis.net/messages/214341
Sur le site, quelques unes de ses réalisations.
• Durée du mariage par génération
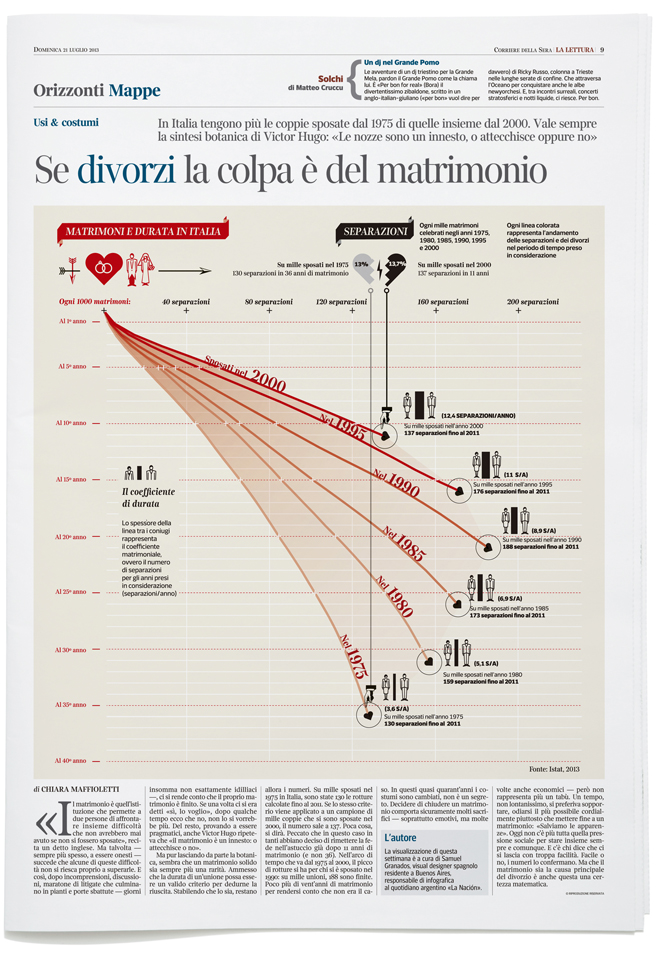
Pas forcément évident, mais vraiment intéressant : considérer ces courbes cumulatives comme des courbes de survie. Du coup, j’aurais présenté le graphique inversé et pivoté
• Liens de #Mubadala, fonds souverain d’Abu Dhabi avec EADS

• Visualisation de la densité de population

Une application en ligne (en lien) permet de la visualiser pour tous les pays du monde.
• Cartogramme en Lego, pour visualiser émigration et immigration aux Amériques

• et pour terminer, quelques pages de son carnet de voyage…
Infographics as “Cuadernos de viaje”. Published in “Público”,
Spain, in the summer of 2010. I designed the image below during a bicycle trip crossing morocco. About the problem of borders in the south of Spain
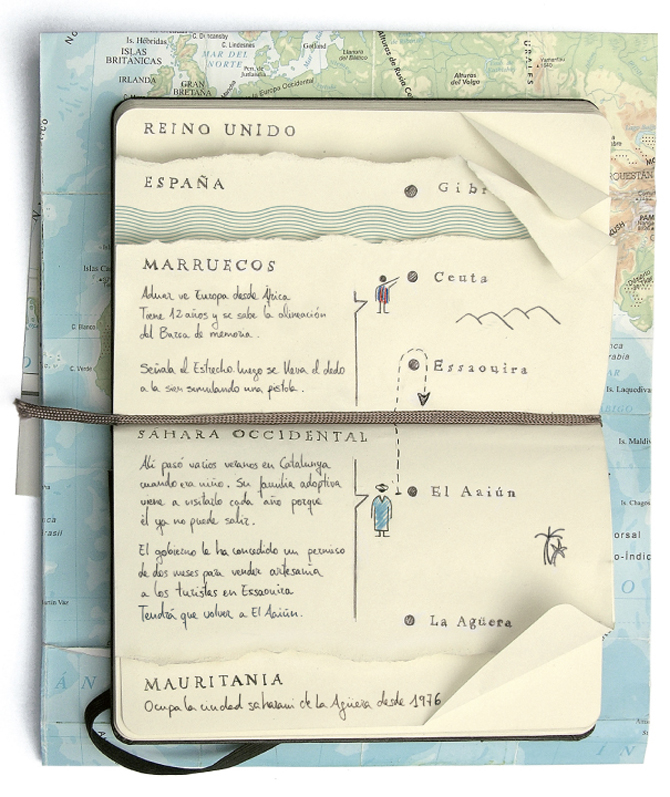
Cities & Desire 3
From Invisible Cities, by Italo Calvino

Comme il le dit (presque) à propos d’une autre de ces créations
The sample [above] is an example that makes us reflect on how thin is the line between numbers and people in statistics visualization.