

Visualizing Cold Starts
▻https://hackernoon.com/visualizing-cold-starts-ddb7c3267419?source=rss----3a8144eabfe3---4
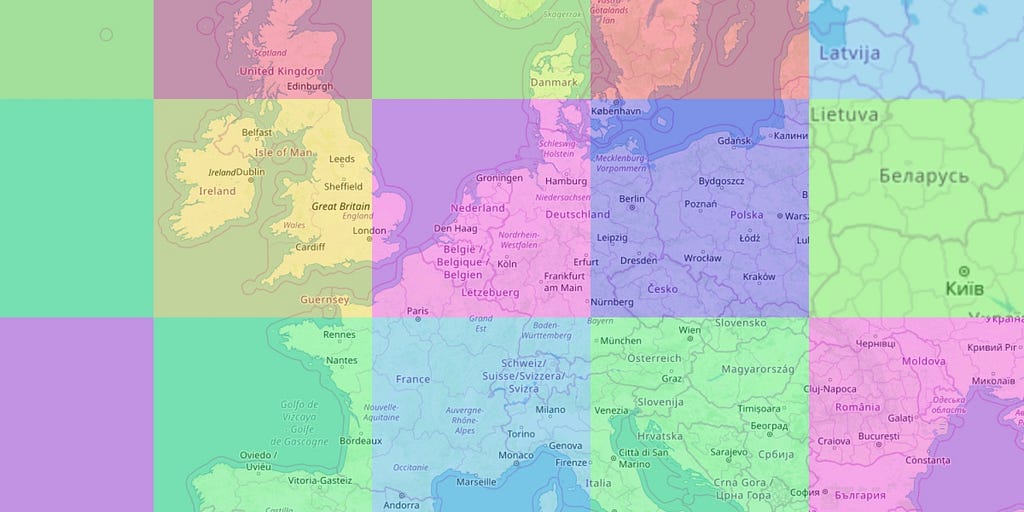
I wrote a lot about cold starts of #serverless functions. The articles are full of charts and numbers which are hopefully useful but might be hard to internalize. I decided to come up with a way to represent colds starts visually.I created HTTP functions that serve geographic maps (map credit Open Street Map). The map is a combination of small square tiles; each tile is 256 by 256 pixels. My selected map view consists of 12 tiles, so 12 requests are made to the serverless function to load a single view.During each experiment, I load the map and then zoom-in three times. The very first view hits the function in a cold state. Subsequently, the zoomed views are loaded from the warm function. There is a timer next to the map which shows the total time elapsed since the beginning until the (...)