


Diagrams of Power
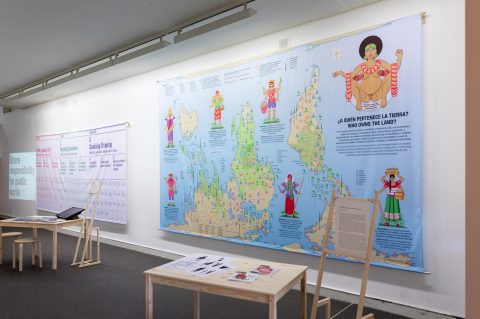
Art and design works using data, diagrams, maps and visualizations as ways of challenging dominant narratives and supporting the resilience of marginalized communities.
 https://www.onomatopee.net/wp-content/uploads/2019/02/Onomatopee-168_Diagrams-of-Power-_-overview-480x319.jpg
 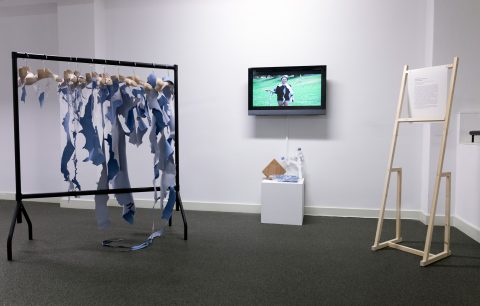 https://www.onomatopee.net/wp-content/uploads/2019/02/Onomatopee-168_Diagrams-of-Power-_-Lize-Mogel-480x306.jpg
 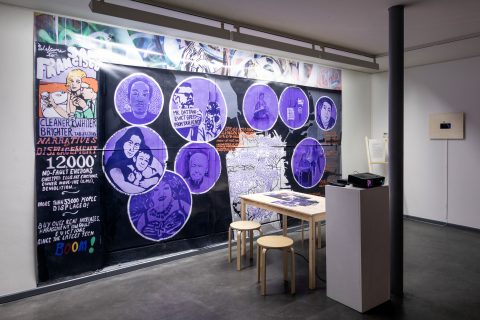 https://www.onomatopee.net/wp-content/uploads/2019/02/Onomatopee-168_AEMP-480x320.jpg
 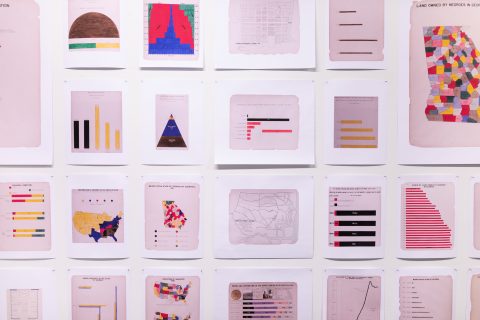 https://www.onomatopee.net/wp-content/uploads/2019/02/Onomatopee-168_Diagrams-of-Power-_-3-480x320.jpg
 ▻https://www.onomatopee.net/exhibition/diagrams-of-power
#pouvoir #cartographie #visualisation #art #art_et_politique #résilience #marginalisation #communautés_marginalisées
–----
Livre :
Diagrams of Power
We draw diagrams to help us think, communicate and put forth what we think is important or what we want to be true. While some diagrams are seen as statements of fact, they can also further agendas by discounting other realities beneath a cloak of perceived objectivity. Diagrams of power work against representations that claim omniscience by speaking from a position, and making visible what and who gets represented and who does the representing. They also make us consider how we create and maintain relations between producers and receivers of particular forms of knowledge.
▻https://www.onomatopee.net/exhibition/diagrams-of-power/#publication_9025
ping @reka @karine4 @mobileborders