


Reflecting on “Vote Cones” / Toph Tucker / Observable
▻https://observablehq.com/@tophtucker/reflecting-on-vote-cones
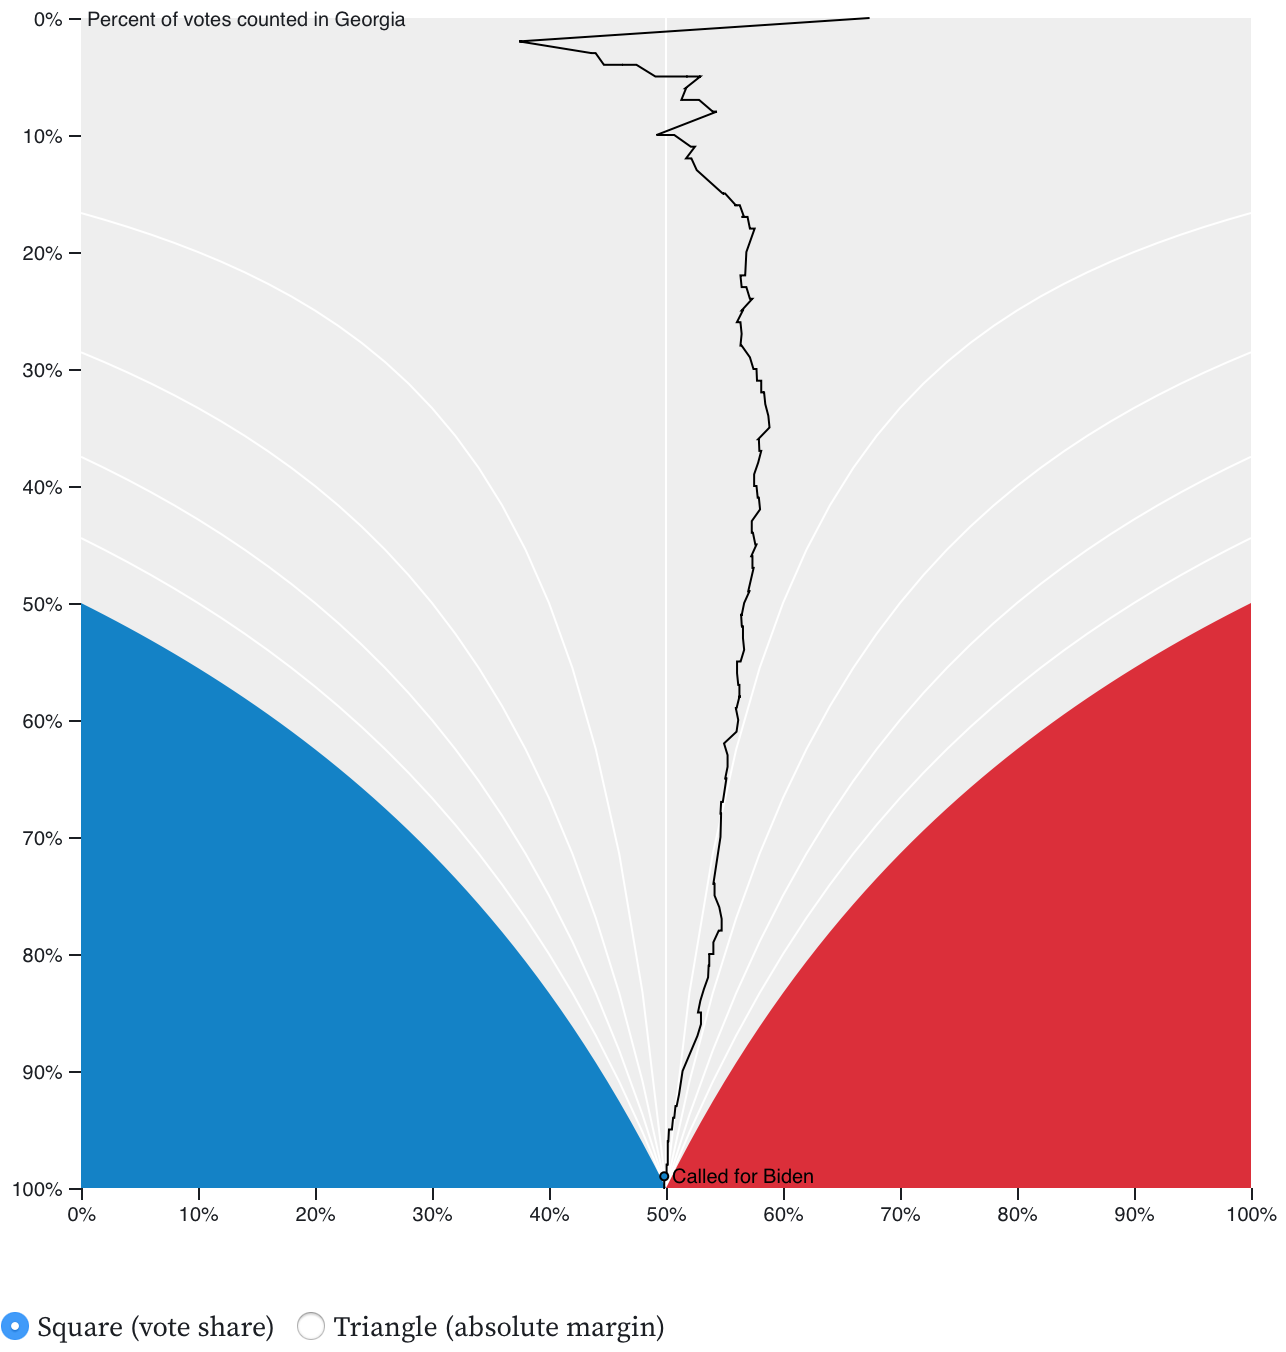
Vote cones show the progress of counting election results in two-candidate first-past-the-post elections, assuming a decent estimate of the total number of votes to be counted. They’re vertical line charts of vote share (or absolute vote margin) against percentage of votes counted, with the addition that they draw the threshold above which a candidate will necessarily win — the “endzones” for each candidate.
For example, here’s one for the 2020 presidential election in Georgia
 https://dl.dropbox.com/s/25i5s8knpekkwen/Vote_Cones1.png
 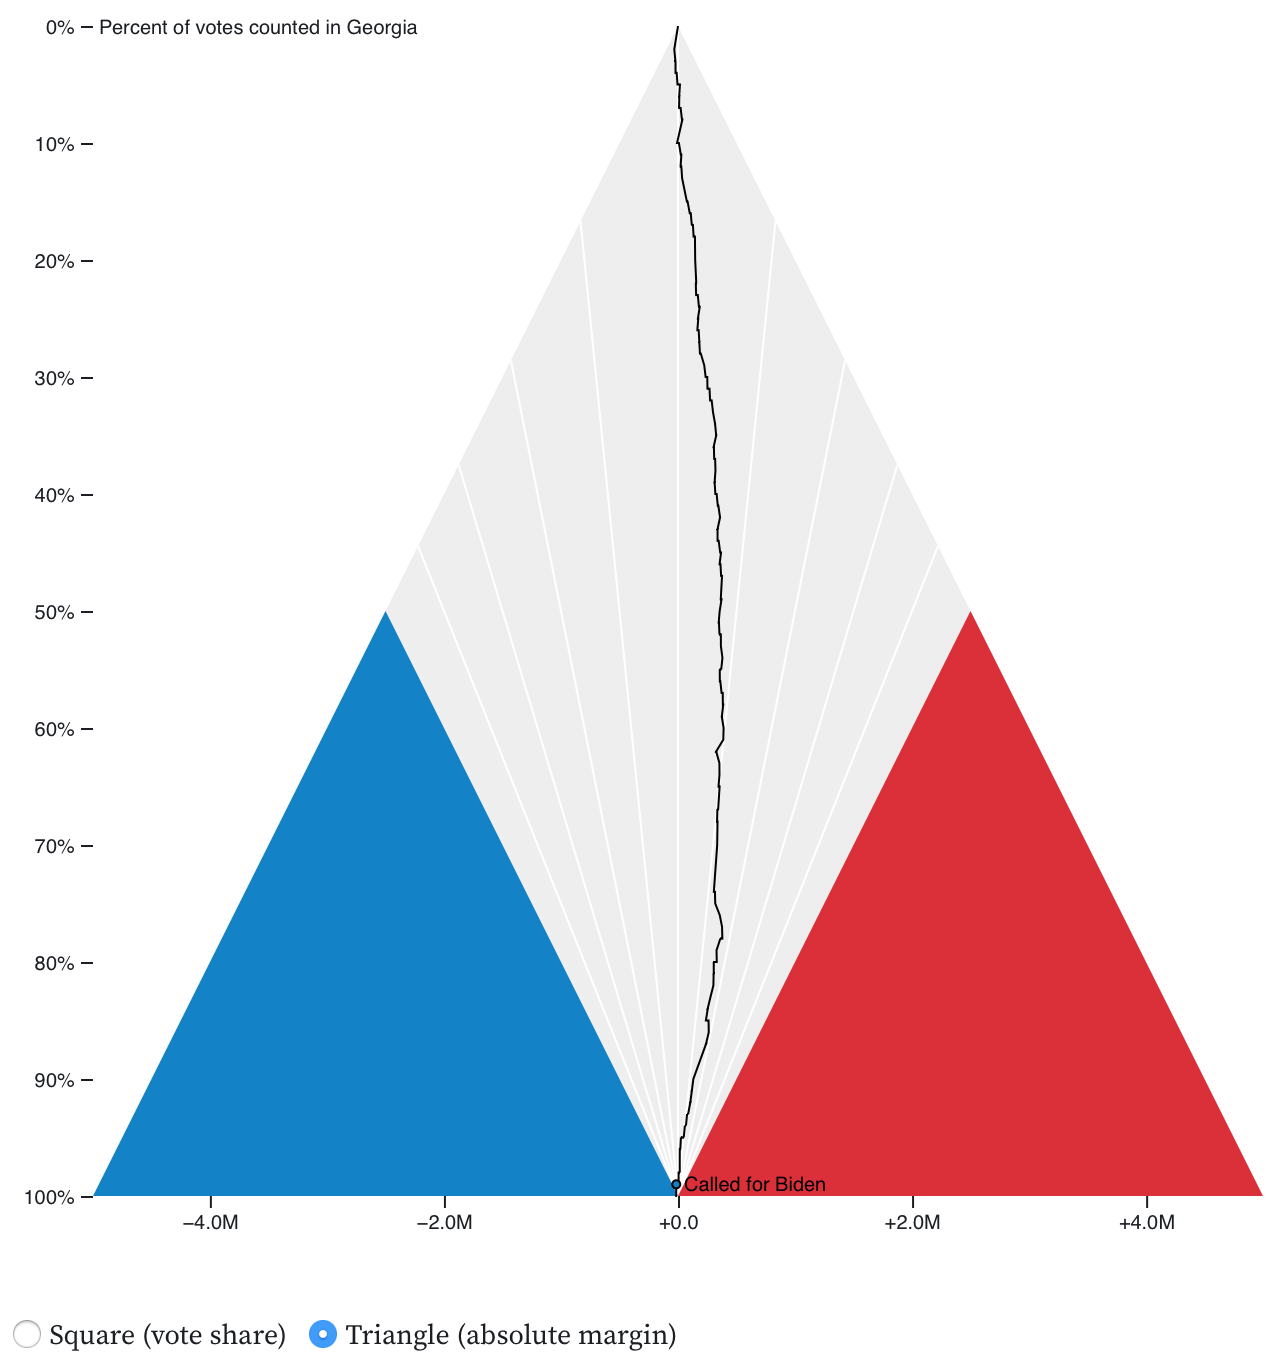 https://dl.dropbox.com/s/x1xojvw4d8x1egr/Vote_Cones2.png
 ping @fil #observable
: