How much Mike Bloomberg is spending on campaign ads - Washington Post
▻https://www.washingtonpost.com/graphics/2020/politics/bloomberg-ad-spending-scale

#visualisation #scrolling (long…!)
How much Mike Bloomberg is spending on campaign ads - Washington Post
▻https://www.washingtonpost.com/graphics/2020/politics/bloomberg-ad-spending-scale
#visualisation #scrolling (long…!)

Database: How many children have experienced school shootings in America? - Washington Post
▻https://www.washingtonpost.com/graphics/2018/local/school-shootings-database
More than 233,000 students have experienced gun violence at school since Columbine
Maps show where disasters strike - Washington Post
▻https://www.washingtonpost.com/graphics/2019/national/mapping-disasters
The fear of losing everything in a natural disaster sits in the back of our minds no matter where we live. The same diverse physical geography that gives us sunny beaches and crisp mountain air also generates devastating storms and wildfires. Climate change is only making things worse.
Data collection for these events has never been more consistent. Mapping the trends in recent years gives us an idea of where disasters have the tendency to strike. In 2018, it is estimated that natural disasters cost the nation almost $100 billion and took nearly 250 lives. It turns out there is nowhere in the United States that is particularly insulated from everything.
Superbe #cartographie
 https://www.washingtonpost.com/graphics/2019/national/mapping-disasters/WIND-ai2html-xlarge.jpg?v=25
 #climat #catastrophes_naturelles (mmmm) #États-Unis
Women running for office: Which candidates could win in the 2018 midterms - Washington Post
▻https://www.washingtonpost.com/graphics/2018/politics/women-congress-governor
Gender pay gap: the day women start working for free - Washington Post
▻https://www.washingtonpost.com/graphics/2017/business/women-pay-gap
The median salary for women working full-time is about 80 percent of men’s. That gap, put in other terms, means women are working for free 10 weeks a year.
So, if you’re a woman ...
... you started working for free a month ago

IN MEXICO, THE PRICE OF AMERICA’S HUNGER FOR HEROIN
Story by Joshua Partlow
Photos by Michael Robinson Chavez
▻https://www.washingtonpost.com/graphics/2017/world/violence-is-soaring-in-the-mexican-towns-that-feed-americas-heroin-h
“Mexico provides more than 90 percent of America’s heroin, up from less than 10 percent in 2003, when Colombia was the main supplier. Poppy production has expanded by about 800 percent in a decade as U.S. demand has soared. The western state of Guerrero is the center of this business, producing more than half of Mexico’s opium poppies, the base ingredient for heroin. Guerrero also has become the most violent state in Mexico, with more than 2,200 killings last year.
“These groups have transformed themselves into a super-criminal power,” said Ricardo Mejia Berdeja, the head of the security committee in the Guerrero state congress. “The anchor for organized crime is heroin poppy.”
Guerrero has produced marijuana and poppies for decades. But organized crime used to be more organized, with one main cartel in the state quietly paying off police and officials and moving drugs. The booming heroin business has encouraged the rise of new gun-toting trafficking bands, which in turn has triggered the rise of citizen militias.”
20 million people are at risk of starving to death. Here’s how it got so bad. - Washington Post
▻https://www.washingtonpost.com/graphics/world/2017-famines
Our world produces enough food to feed all its inhabitants. When one region is suffering severe hunger, global humanitarian institutions, though often cash-strapped, are theoretically capable of transporting food and averting catastrophe.
But this year, South Sudan slipped into famine, and Nigeria, Somalia and Yemen are each on the verge of their own. Famine now threatens 20 million people — more than at any time since World War II. As defined by the United Nations, famine occurs when a region’s daily hunger-related death rate exceeds 2 per 10,000 people.
The persistence of such severe hunger, even in inhospitable climates, would be almost unthinkable without war.
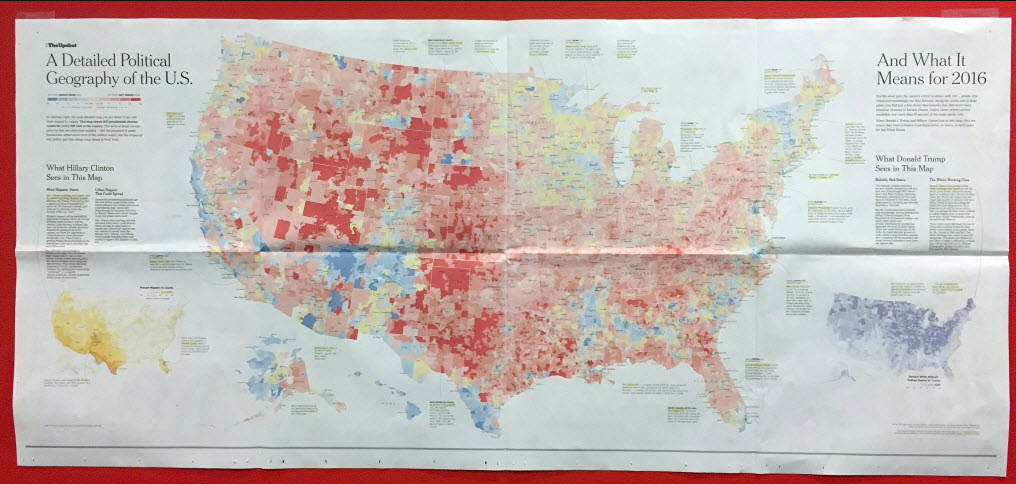
La méga carte électorale publiée par le NYT a suscité des critiques, un point de vue du WashPo, et bien sûr la réponse du NYT à la critique
▻http://cartonerd.blogspot.fi/2016/11/the-nyt-election-map.html
▻https://www.washingtonpost.com/graphics/politics/2016-election/how-election-maps-lie
▻http://www.nytimes.com/interactive/2016/11/01/upshot/many-ways-to-map-election-results.html
en lien avec
►http://visionscarto.net/laisses-pour-compte-cartes-demographiques
#cartographie #cartogrammes #méthodologie #élections #États-Unis


Je venais de la poster, j’avais pas vu que @fil avait tiré le premier. J’efface et je continue ici.
A spread of four pages, ça me rappelle de mauvais souvenirs haha ! :) Mais là en revanche, c’est bien !
The search for a better US election map
▻https://www.ft.com/content/3685bf9e-a4cc-11e6-8b69-02899e8bd9d1
Having tested these options and debated at length, we arrived at a compromise map for our live results graphic that attempts to take the best from the other methods.
The white underlying geographic map places states in their familiar size, shape and location, allowing them to be identified quickly. Using a cluster of dots rather than a solid fill to represent the outcome ensures that the amount of red and blue on the map accurately reflects states’ weight in the election outcome, rather than the (irrelevant) surface area.
Like the tiled grid cartogram, the number of electoral votes in each state is easy to compare visually without counting or interpreting numbers printed on the map.
(j’aime beaucoup cette solution)
How Trump redrew the electoral map, from sea to shining sea - Washington Post
▻https://www.washingtonpost.com/graphics/politics/2016-election/election-results-from-coast-to-coast