


Moving Borders with QGIS | Aten Design Group
▻http://atendesigngroup.com/blog/moving-borders-qgis
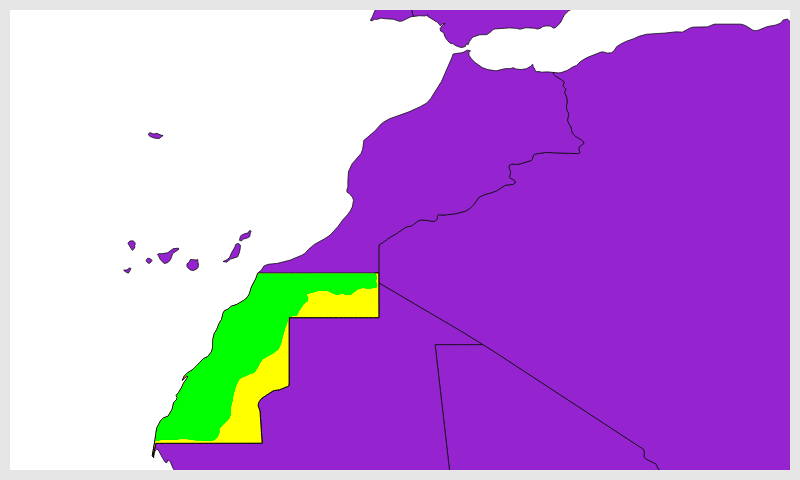
the Sahrawi Arab Democratic Republic (SADR) which is currently recognized by 84 UN member states claims approximately the southern half of this area.
Moving Borders with QGIS | Aten Design Group
▻http://atendesigngroup.com/blog/moving-borders-qgis
the Sahrawi Arab Democratic Republic (SADR) which is currently recognized by 84 UN member states claims approximately the southern half of this area.

Natural Earth Vector draws boundaries of sovereign states according to defacto status. We show who actually controls the situation on the ground. For instance, we show China and Taiwan as two separate states. But we show Palestine as part of Israel. Please feel free to mashup our countries and disputed areas themes to match your particular political outlook.
▻http://www.naturalearthdata.com/downloads/10m-cultural-vectors/10m-admin-0-details
▻http://www.naturalearthdata.com/forums/topic/disputed-territories-type-field
bon alors, j’ai suivi le tuto, mais malheureusement ça ne marche qu’à moitié : j’ai bien la « frontière » entre MAR et SAH, mais la topologie de la frontière entre SAH et MRT n’est pas bonne…en fait je suis pas certain que ce soit le bon outil
à suivre
PS : ça y est j’ai fini par trouver une procédure adéquate.
Natural Earth et la frontière Maroc-Algérie c’est aussi un peu approximatif … ci-dessous la différence entre les versions 110m et 50m du fichier admin_0_countries :

The orientation of international borders:
▻http://vizual-statistix.tumblr.com/post/86597730876/a-couple-months-ago-i-made-some-road-orientation

#carte #visualisation #cartographie #frontière
A couple months ago, I made some road orientation graphics. I thought it would be interesting to repeat the exercise using the borders between countries.
The method is slightly different for this graphic, so I’ll explain it in full. The polyline shapefile from the data source was separated by continent. Country borders that divide continents were attributed to both continents, but continental borders that divide a single country (e.g., the Asia-Europe border in Russia) were not considered. Oceanic coastal boundaries were not part of the shapefile, and were not of interest – the goal was to see how people define boundaries. Each continent’s polyline was then divided into 1 km segments. This weights the borders by length, and is at a small enough scale that it captures the oddities of the borders. The original shapefile was somewhat generalized, and I was concerned that any smaller length unit would return spurious results. For each continent, the azimuths of the segments were measured in the respective continental Lambert conformal projection; because continents are very large, there will be a small error associated with this measurement. These azimuths were then duplicated using opposing directions (e.g., 45° was repeated as 225°) to ensure rotational symmetry on the rose diagrams, which are plotted in 5° bins.
Please keep in mind that the map in the graphic is a Miller cylindrical projection, which is not conformal. So while a continent’s international borders may not seem to match the rose diagram, there is some distortion in the map projection. In addition, because the measurements are made at the kilometer scale, long borders that have an overall trend in one direction (e.g., Argentina-Chile) may actually have a significant contribution to an oblique or orthogonal direction. You could compare this to walking along a trail with switchbacks: you are generally heading in one direction, but most of your time is spent walking in a perpendicular direction.
The results of the analysis are fascinating – I’d love to hear what Jared Diamond has to say about these. All five graphs have a strong W-E signal; this is especially surprising with South America and Africa, which have significant latitudinal spans compared to their longitudinal extents. I’m not much of a history buff, so I won’t even try to interpret the meaning of the results…
Data source: ▻http://www.naturalearthdata.com/downloads/10m-cultural-vectors (land boundary lines)

Downloads | Natural Earth
►http://www.naturalearthdata.com/downloads
Global vector data at three different scales, optimized for rendering images of large regions, countries and continents, up to about zoom=9. Data themes are available in three levels of detail. For each scale, themes are listed on Cultural, Physical, and Raster category pages.


