

Analysing 1.4 billion rows with #python
▻https://hackernoon.com/analysing-1-4-billion-rows-with-python-6cec86ca9d73?source=rss----3a8144
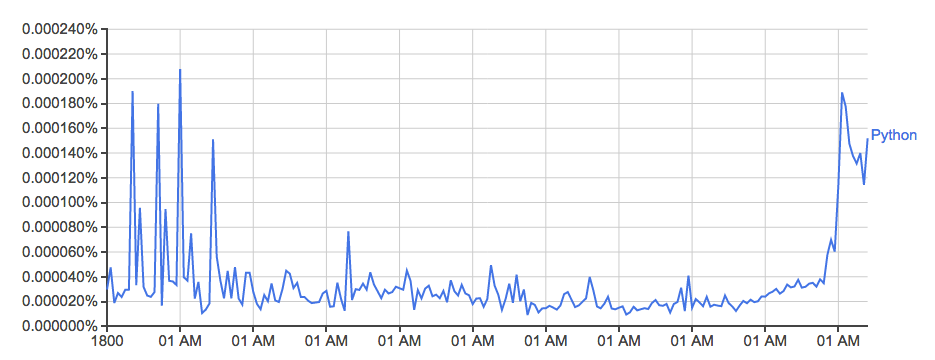
Using pytubes, numpy and matplotlibThe Google Ngram viewer is a fun/useful tool that uses Google’s vast trove of data scanned from books to plot word usage over time. Take, for example, the word Python (case sensitive):Untitled graph taken from: ▻https://books.google.com/ngrams/graph?content=Python&year_start=1800&corpus=15&smoothing=0 charting the usage of the word ‘Python’ over time.It’s powered from google’s n-gram dataset, a log of the number of times a particular word or sequence of words was spotted by google books during each publication year. While not complete (it doesn’t include every book ever published!), there are millions of books in the set, including books published in the 1500s and up to 2008. The dataset can be freely downloaded here.I decided to see how easy it (...)
