Chart Templates Part 1: #Sankeys - Ken Flerlage: Analytics Architecture, Strategy, & Visualization
▻http://www.kenflerlage.com/2018/04/sankey-template.html
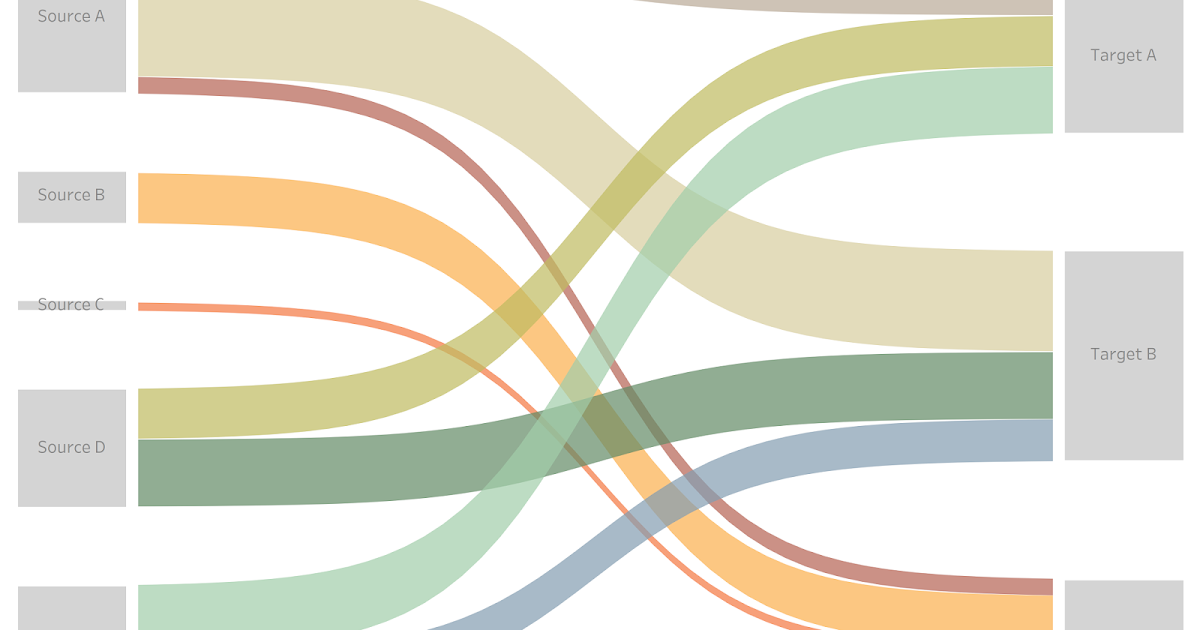
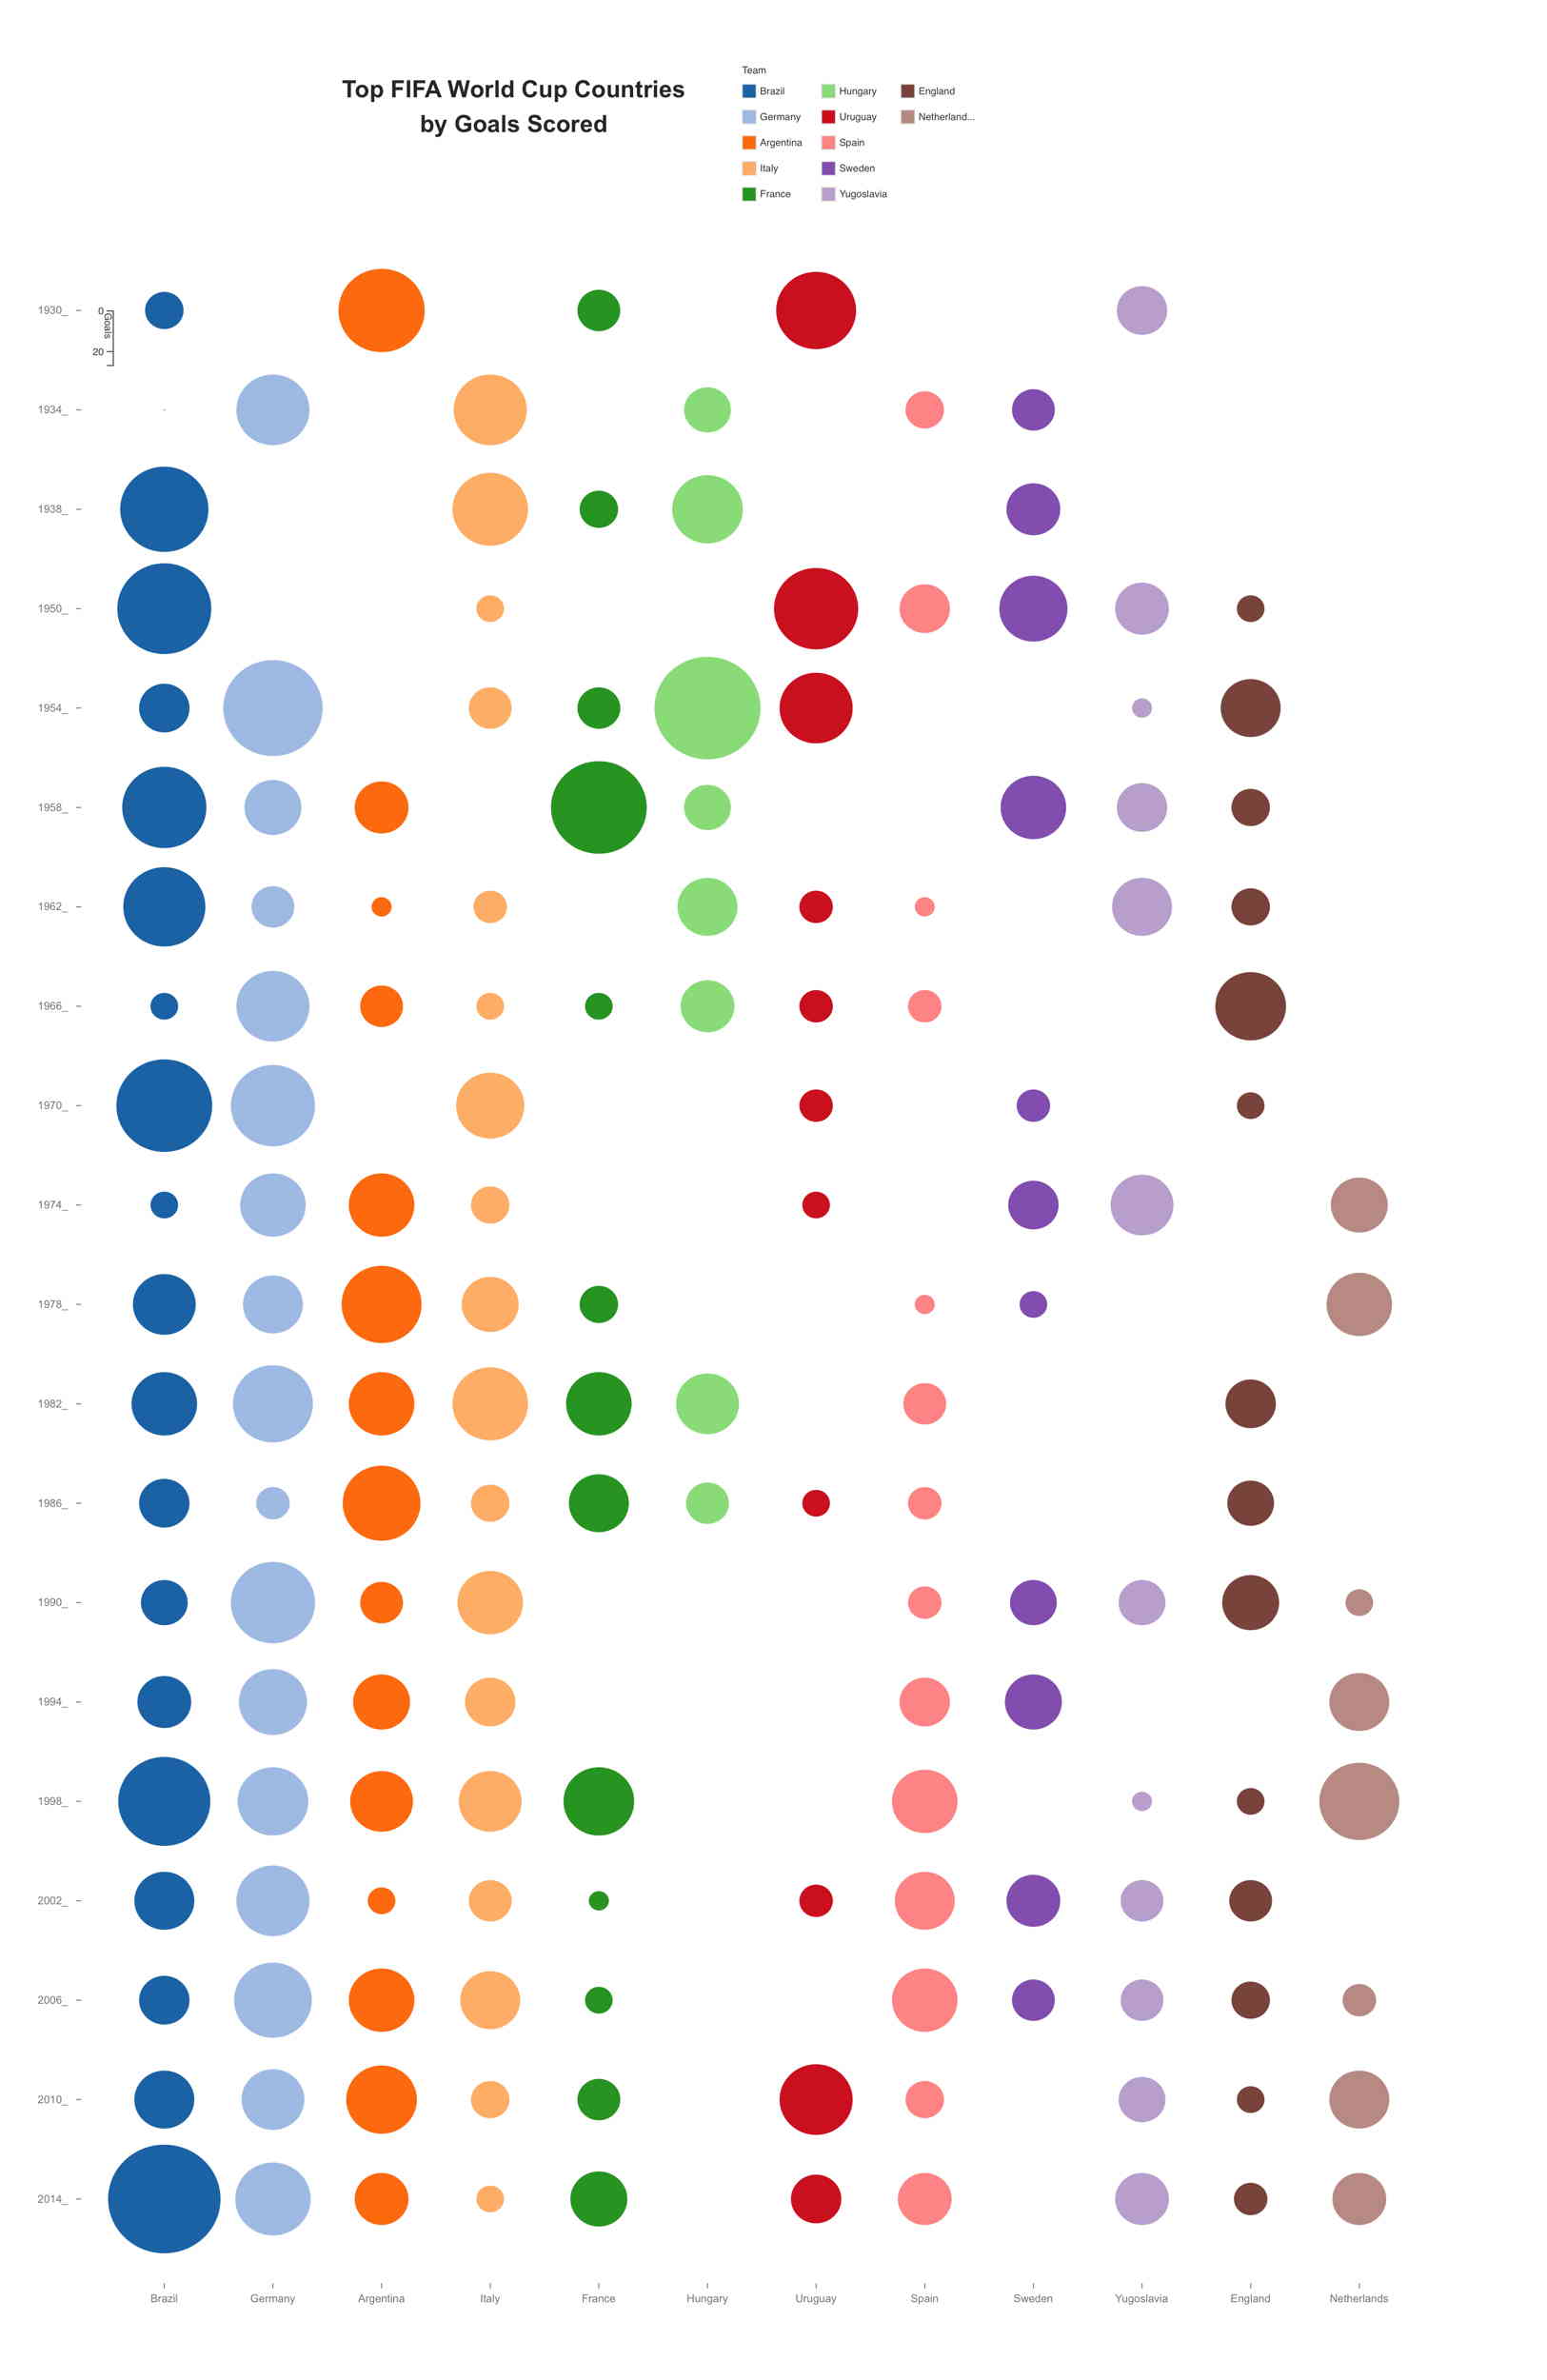
Recently, Rodrigo Calloni mentioned to me that he wanted to create a visualization for the upcoming 2018 FIFA World Cup. His idea was to create a sankey diagram showing the top 10 countries and the number of goals scored in each World Cup. But he hadn’t previously created a sankey and wondered if I could help. Fortunately, I had previously built a nice template for sankeys which I provided to him and resulted in the following visualization (click on the image to see the interactive version).