World Nuclear Industry Status Report 2018 (HTML)

/World-Nuclear-Industry-Status-Report-20

  • Explaining the plummeting cost of solar power | MIT News
    http://news.mit.edu/2018/explaining-dropping-solar-cost-1120

    Researchers uncover the factors that have caused photovoltaic module costs to drop by 99 percent.

    (...) government policy to help grow markets around the world played a critical role in reducing this technology’s costs.

    La France a mis tous ses moyens dans le #nucléaire, dont le prix n’a pas baissé (bien au contraire). Grands stratèges !

    At the device level, the dominant factor was an increase in “conversion efficiency,” or the amount of power generated from a given amount of sunlight.

    #recherche #énergie

    • World Nuclear Industry Status Report 2018
      https://www.worldnuclearreport.org/World-Nuclear-Industry-Status-Report-2018-HTML.html

      Investment. Global reported investment for the construction of the four commercial nuclear reactor projects (excluding the demonstration CFR-600 in China) started in 2017 is nearly US$16 billion for about 4 GW. This compares to US$280 billion renewable energy investment, including over US$100 billion in wind power and US$160 billion in solar photovoltaics (PV). China alone invested US$126 billion, over 40 times as much as in 2004. Mexico and Sweden enter the Top-Ten investors for the first time. A significant boost to renewables investment was also given in Australia (x 1.6) and Mexico (x 9). Global investment decisions on new commercial nuclear power plants of about US$16 billion remain a factor of 8 below the investments in renewables in China alone.

      Installed Capacity. In 2017, the 157 GW of renewables added to the world’s power grids, up from 143 GW added the previous year, represent the largest increase ever. The increase accounted for more than 61 percent of net additions to global power generating capacity. Wind added 52 GW and solar PV a record 97 GW. These numbers compare to a 3.3 GW increase for nuclear power.

      Electricity Generation. Nine of the 31 nuclear countries, Brazil, China, Germany, India, Japan, Mexico, Netherlands, Spain and U.K.—a list that includes three of the world’s four largest economies—generated more electricity in 2017 from non-hydro renewables than from nuclear power.

      In 2017, annual growth for global generation from solar was over 35 percent, for wind power over 17 percent, and for nuclear power 1 percent, exclusively due to China.

      Compared to 1997, when the Kyoto Protocol on climate change was signed, in 2017 an additional 1,100 TWh of wind power was produced globally and 442 TWh of solar PV electricity, compared to nuclear’s additional 239 TWh.

      In China, as in the previous five years, in 2017, electricity production from wind alone (286 TWh), by far exceeded that from nuclear (233 TWh). The same phenomenon is seen in India, where wind power (53 TWh) outpaced nuclear—stagnating at 35 TWh—for the second year in a row.

  • World Nuclear Industry Status Report 2018 (HTML) - World Nuclear Industry Status Report

    https://www.worldnuclearreport.org/World-Nuclear-Industry-Status-Report-2018-HTML.html

    #nucléaire #nuclaire_civil et bravo @odilon !

    China Still Dominates Developments

    Nuclear power generation in the world increased by 1% due to an 18% increase in China.
    Global nuclear power generation excluding China declined for the third year in a row.
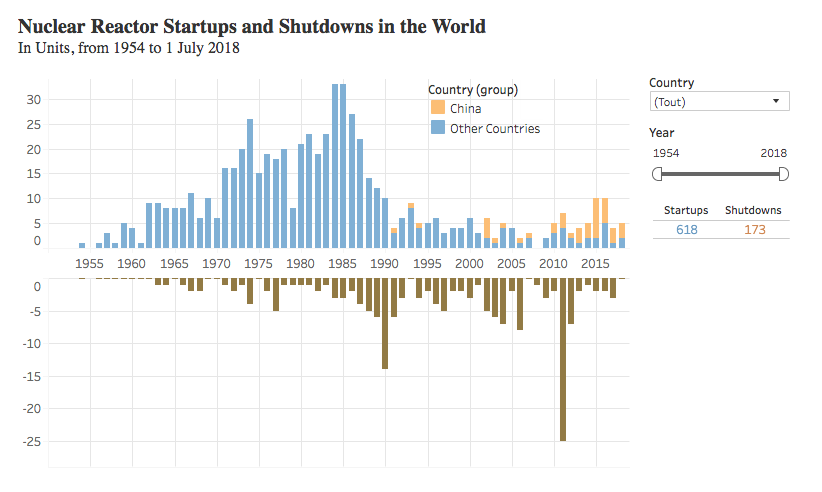
    Four reactors started up in 2017 of which three were in China and one in Pakistan (built by a Chinese company).
    Five units started up in the first half of 2018, of which three were in China—including the world’s first EPR and AP1000—and two in Russia.
    Five construction starts in the world in 2017, of which a demonstration fast reactor project in China.
    No start of construction of any commercial reactors in China since December 2016.
    The number of units under construction globally declined for the fifth year in a row, from 68 reactors at the end of 2013 to 50 by mid-2018, of which 16 are in China.
    China spent a record US$126 billion on renewables in 2017.

    Operational Status and Construction Delays

    The nuclear share of global electricity generation remained roughly stable over the past five years (-0.5 percentage points), with a long-term declining trend, from 17.5 percent in 1996 to 10.3 in 2017.
    Seven years after the Fukushima events, Japan had restarted five units by the end of 2017—generating still only 3.6% of the power in the country in 2017—and nine by mid-2018.
    As of mid-2018, 32 reactors—including 26 in Japan—are in Long-Term Outage (LTO).
    At least 33 of the 50 units under construction are behind schedule, mostly by several years. China is no exception, at least half of 16 units under construction are delayed.
    Of the 33 delayed construction projects, 15 have reported increased delays over the past year.
    Only a quarter of the 16 units scheduled for startup in 2017 were actually connected to the grid.
    New-build plans have been cancelled including in Jordan, Malaysia and the U.S. or postponed such as in Argentina, Indonesia, Kazakhstan.

    Decommissioning Status Report

    As of mid-2018, 115 units are undergoing decommissioning—70 percent of the 173 permanently shut-down reactors in the world.
    Only 19 units have been fully decommissioned: 13 in the U.S., five in Germany, and one in Japan. Of these, only 10 have been returned to greenfield sites.

    Interdependencies Between Civil and Military Infrastructures

    Nuclear weapon states remain the main proponents of nuclear power programs. A first look into the question whether military interests serve as one of the drivers for plant-life extension and new-build.

    Renewables Accelerate Take-Over

    Globally, wind power output grew by 17% in 2017, solar by 35%, nuclear by 1%. Non-hydro renewables generate over 3,000 TWh more power than a decade ago, while nuclear produces less.
    Auctions resulted in record low prices for onshore wind (<US$20/MWh) offshore wind (<US$45/MWh) and solar (<US$25/MWh). This compares with the “strike price” for the Hinkley Point C Project in the U.K. (US$120/MWh).
    Nine of the 31 nuclear countries—Brazil, China, Germany, India, Japan, Mexico, Netherlands, Spain and United Kingdom (U.K.)—generated more electricity in 2017 from non-hydro renewables than from nuclear power.