
Visualizing State Drug Utilization Data Sets
▻https://hackernoon.com/visualizing-state-drug-utilization-data-sets-bf65e990a766?source=rss----
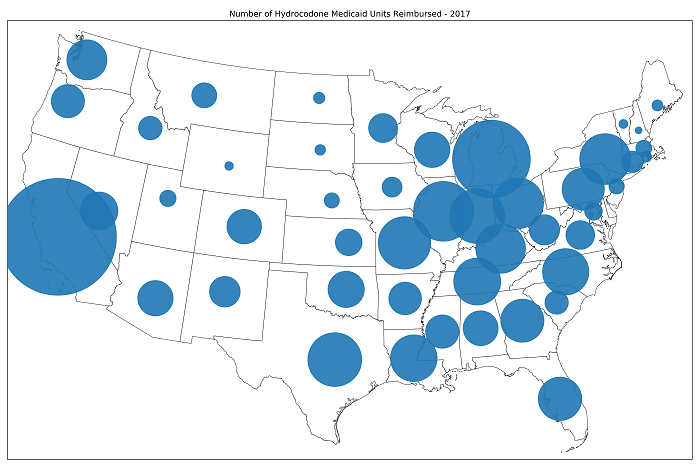
Before any predictive ML models can be applied to a data set it is important to thoroughly understand the data. Using visualizations is a very effective method of digging deeper into what the data.This is important prior to using any ML predictive models, in order to ensure meaningful and actionable outcomes.The goal of this case study is to illustrate how to use python to better understand the data. In this case we are going to use State Drug Utilization data sets which can be found from the Medicaid.gov website. Creating visually rich images of tabular data can provide insights that are often difficult to see in tabular format.Examples of what can be created include displaying the total number of hydrocodone(a narcotic analgesic) units that were reimbursed by Medicare in 2017. The (...)
#data-visualization #analytics #programming #data-science #healthcare