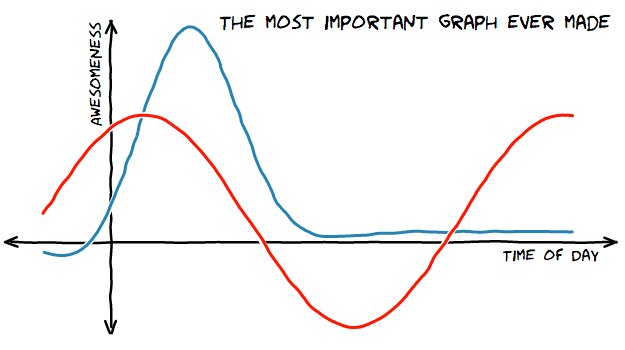
xkcd-style charts in R, JavaScript, and Python
►http://flowingdata.com/2012/10/19/xkcd-style-charts-in-r-javascript-and-python
The ports and packages to make your charts look like the came out of the web comic xkcd are coming out in rapid fashion. Dan Foreman-Mackey stylized charts in JavaScript using D3, Mark Bulling did the same in R, and Jake Vanderplas described how he did in Python.
#data #visualisation via @opironet