
Inequality and segregation in Athens: Maps and data
Our aim in this chapter is to illustrate inequalities and segregation across several fields, like employment, education and housing.
These inequalities and segregation are mainly revealed through the following 180 maps. These were organised in 17 dynamic groupings of maps, each one comprising a distribution of hierarchical categories within a specific field in order to increase the visibility of the spatial structure of inequalities and segregation. For example, one of these dynamic groupings depicts the areas of residence of the population according to their education level (2.1 Educational level), based on an ordinal scale.
Apart from the thematic sections in this chapter, an additional section comprise maps resulting from synthesis of data from different fields and following different statistical and mapping techniques. It is the section on the social typology of residential areas.
The following list comprises the themes of the chapter that the reader can directly access by clicking on the active link in each title.
Thematic sections:
1. Demography
1.1 Age groups
1.2 Family status
1.3 Household type
1.4 Ethic groups
2. Education
2.1 Education level
2.2 Youth not in education
2.3 Country of studies
3. Employment
3.1 Main activity
3.2 Occupations
3.3 Sectors of economic activity
3.4 Branches of economic activity
4. Housing and living standards
4.1 Main sources of income
4.2 House tenure
4.3 Housing units size
4.4 Housing surface per capita
4.5 Age of housing stock
4.6 Heating system
4.7 Access to the internet
4.8 Private cars
5. Composite themes
5.1 Social typology of residential areas
All the data used to produce the maps in this chapter originate from the 2011 Census of the Greek Statistical Authority (ELSTAT) and some additional data originate from previous censuses (1991, 2001). They were all accessed through the online application “Panorama of Greek Census Data 1991-2011” (►https://panorama.statistics.gr/en), which is the outcome of a long cooperation between the National Centre for Social Research (EKKE) and ELSTAT.
Users can access directly the data used to produce the maps in this entry. They can be used to map the same phenomena in alternative ways through the mapping options provided by the application “Panorama of Greek Census Data 1991-2011” (menu: tools\import custom data). Further information is provided in a separate file.
This online application provides data for spatially detailed analyses for all Greek cities with a population over 50.000 in 2011. The spatial units of analysis are small units called URANUs (Urban Analysis Units) and correspond more or less to ELSTAT’s census tracts. Metropolitan Athens comprises 3.000 URANUs with an average population of 1.200, which shows that the following analysis is much more detailed than the usual analysis on the local authority level (59 local authorities or, at best, their 117 municipal and local community subdivisions, which moreover are very uneven in size).
The area covered by the maps is not the entire urbanised area, but the broader central part of the metropolitan area. It comprises the most populous areas and extends from the coast of Eastern Attiki to Elefsina. Areas like Lavreotiki, part of Kalyvia, Megara, Nea Peramos, part of Salamina and Grammatiko were left outside the map. All these areas excluded from the map may have some interest, but their inclusion would reduce the visibility of differences among spatial units in the smaller but much more populated and densely built parts of the city.
 https://www.athenssocialatlas.gr/wp-content/uploads/2019/09/tx132_Branch_1d_V_en.gif
 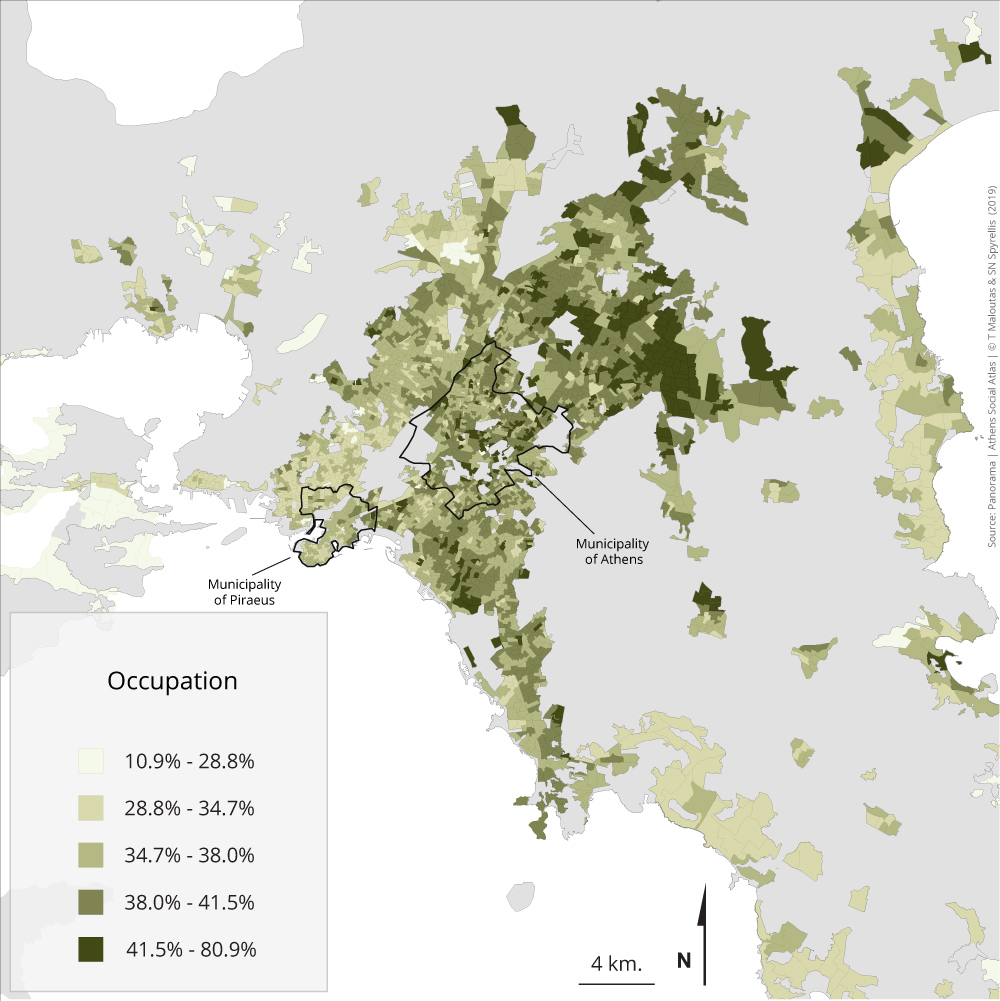 https://www.athenssocialatlas.gr/wp-content/uploads/2019/09/tx132_Source5_en.jpg
 ▻https://www.athenssocialatlas.gr/en/article/inequality-and-segregation-in-athens
#inégalités #ségrégation #Athènes #cartographie #visualisation #Grèce