


Tracking 30 Years of Sea Level Rise
▻https://earthobservatory.nasa.gov/images/150192/tracking-30-years-of-sea-level-rise
The altimetry data also show that the rate of sea level rise is accelerating. Over the course of the 20th century, global mean sea level rose at about 1.5 millimeters per year. By the early 1990s, it was about 2.5 mm per year. Over the past decade, the rate has increased to 3.9 mm (0.15 inches) per year.
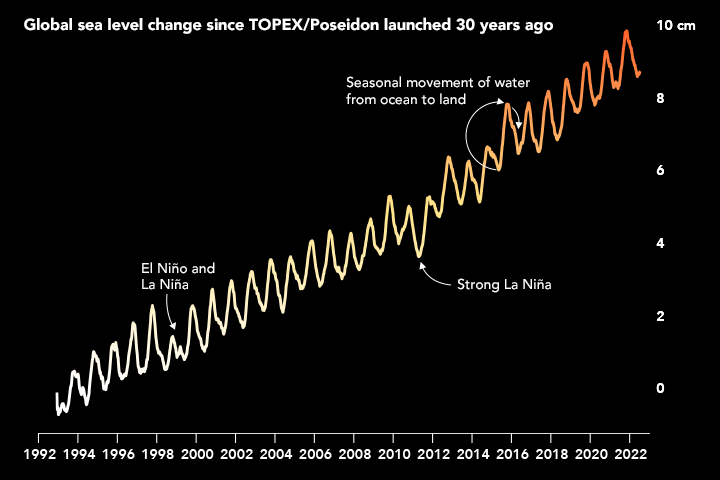
In the line plot, the highs and lows each year are caused by the exchange of water between the land and sea. “Winter rain and snowfall in the northern hemisphere shifts water from ocean to land, and it takes some time for this to runoff back into the oceans,” Willis noted. “This effect usually causes about 1 centimeter of rise and fall each year, with a bit more or less during El Niño and La Niña years. It’s literally like the heartbeat of the planet.”
[…]
“What stands out from the satellite altimetry record is that the rise over 30 years is about ten times bigger than the natural exchange of water between ocean and land in a year,” [Josh] Willis[, an oceanographer at the Jet Propulsion Laboratory] said. “In other words, the human-caused rise in global sea level is now ten times bigger than the natural cycles.”