World population by level of fertiliy over time (1950 - 2010) - Vivid Maps
▻http://www.vividmaps.com/2015/10/world-population-by-level-of-fertiliy.html
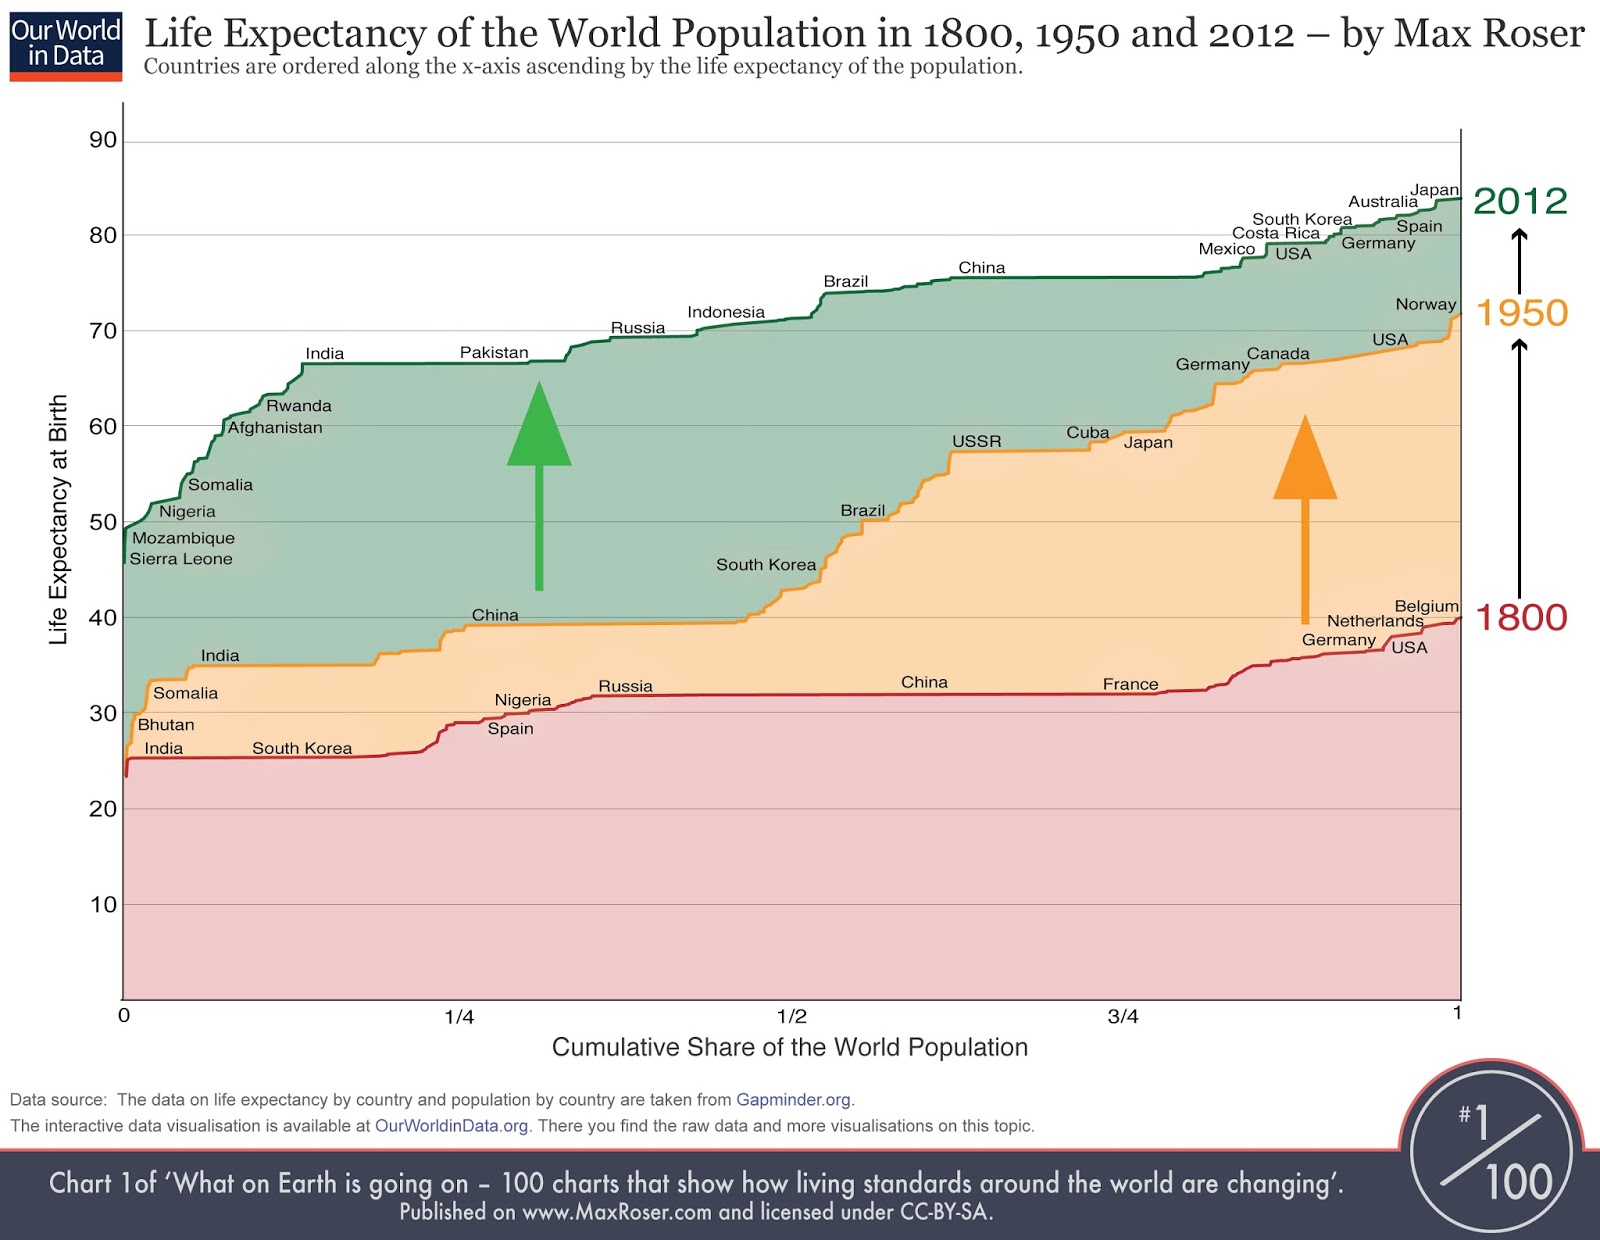
Très intéressante visualisation de l’évolution des taux de fertilité, signalé par Pierre Ageron sur Twitter à qui je dis merci. Ce graphique montre que parfois, ce n’est pas la peine de chercher à faire complexe ou archi-original, ioci, c’est très simple et très direct et l’effet est très « spectaculaire »
Auteur :
Max Roser
▻http://www.maxroser.com/about
I am an economist working at the University of Oxford. My research interests are the growth and distribution of living standards.
Most of my research is concerned with inclusive and sustainable growth. These interests go back to my studies: In addition to economics I studied philosophy and geoscience. (I have a BSc in geoscience, a BA and an MA in philosophy, an MSc in economics, and a doctorate from the University of Innsbruck, Austria.)

World population by level of fertiliy over time (1950 - 2010)