How Parking Conquered Los Angeles, in 14 Facts, Maps, and Figures - CityLab
▻http://www.citylab.com/commute/2015/12/parking-los-angeles-maps-study/418593
Although it might feel like there’s never anywhere to park, most U.S. cities have way more spots than they’ll ever need. But getting a precise count of all the curbside, garage, and surface lot parking in a city is a daunting task, to say the least, which often requires the use of satellite imagery. Tracking that space over a century seems almost unimaginable.
And yet a research group has done just that for Los Angeles County. Using detailed local information on zoning codes and developer parking minimums, as well as population data within county census tracts, the researchers took a full accounting of L.A.’s on- and off-street parking infrastructure from 1900 to 2010. This “spatially explicit inventory,” as they call it in the Journal of the American Planning Association, ties the metro area’s historic spread of abundant parking to the infamous car-reliance and highway growth of today.

Which comes out to 3.3 spots for every car
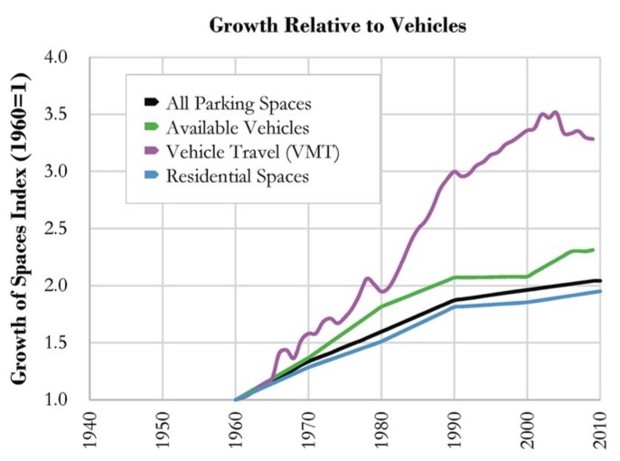
For those 18.6 million spots, there are a mere 5.6 million registered county vehicles vying for them. In other words, 3.3 spaces exist for every car in the city (a handy stat the next time an Angelino complains about finding parking). Much of that gap occurred as a result of parking requirements imposed during the first half of the 20th century; while the county gained more parking spots than cars from 1950 to 1975, vehicle growth outpaced parking growth after that time—suggesting that the availability of spaces encouraged more people to get cars.