Via Nathan Yau de Flowing Data et repris par le NYT. Toujours très intéressant...
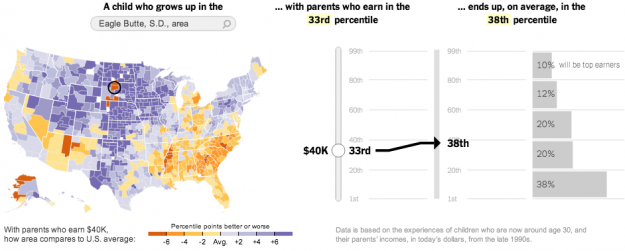
In a study conducted by researchers at Harvard and UC Berkeley, data shows spatial variations for the chances of rising out of poverty into higher income brackets. The New York Times reports:
Climbing the income ladder occurs less often in the Southeast and industrial Midwest, the data shows, with the odds notably low in Atlanta, Charlotte, Memphis, Raleigh, Indianapolis, Cincinnati and Columbus. By contrast, some of the highest rates occur in the Northeast, Great Plains and West, including in New York, Boston, Salt Lake City, Pittsburgh, Seattle and large swaths of California and Minnesota.
“Where you grow up matters,” said Nathaniel Hendren, a Harvard economist and one of the study’s authors. “There is tremendous variation across the U.S. in the extent to which kids can rise out of poverty.”
Two things. First, the NYT piece is really nice. Graphics and interactives are typically shown separate from the written story, but NYT has been shifting as of late and I’m sure other publications will follow. (Although, as you can see in the credits, eight people made the graphics, and most places don’t have such resources yet.) The story is all tied together, so you read and interact in a continuous flow.
Second, the Harvard/UC Berkeley research group released the data, so you can have a go yourself.


 http://i2.wp.com/flowingdata.com/wp-content/uploads/2015/06/Atlas-Cover.png?resize=960%2C548
 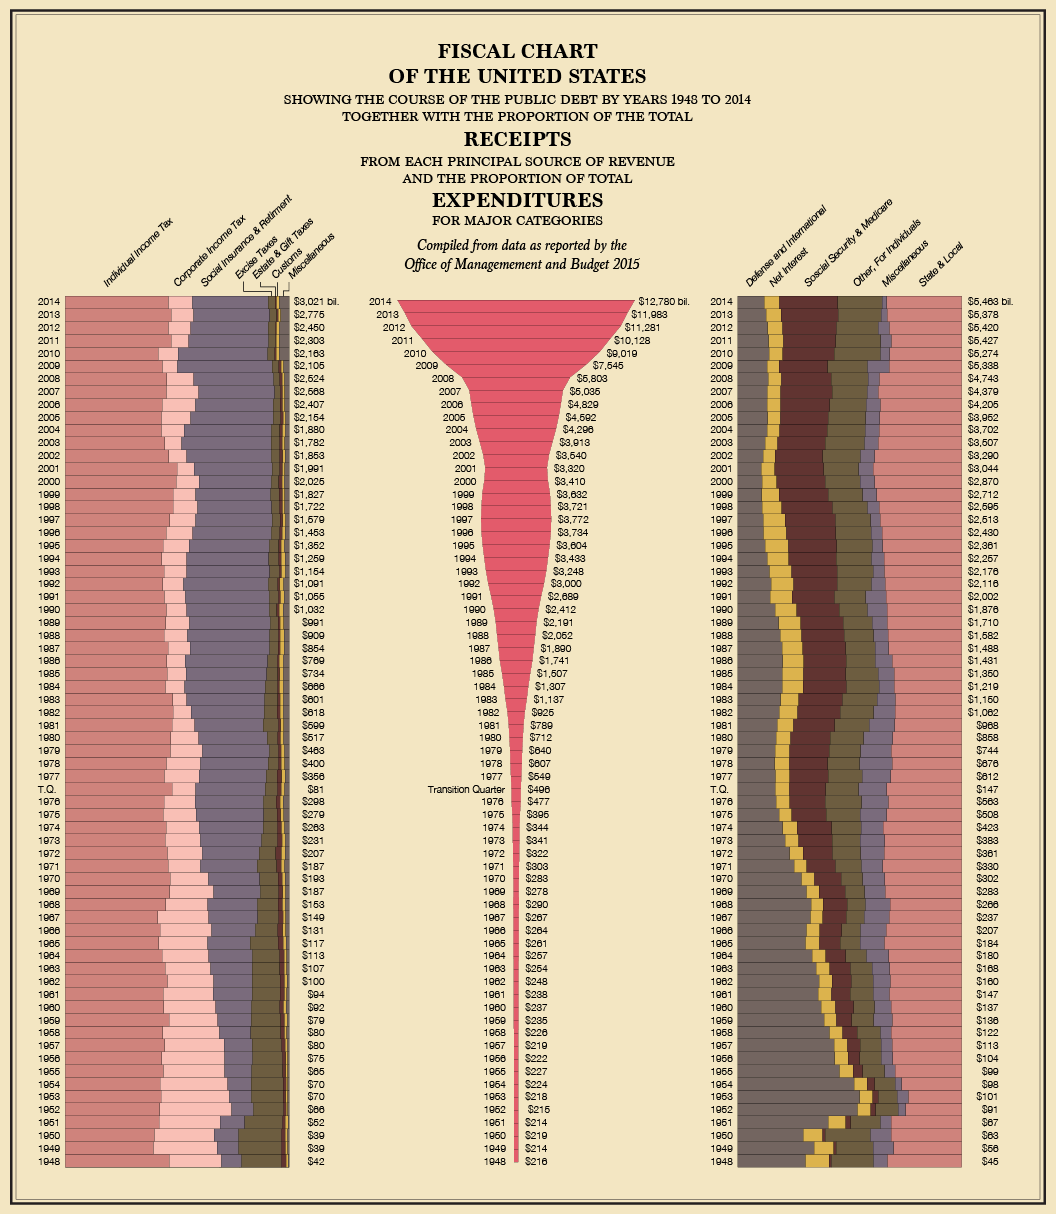 http://flowingdata.com/wp-content/uploads/2015/06/fiscal-chart.png