

Annotations in maps – story-telling in an interesting avatar
▻https://www.geospatialworld.net/blogs/annotations-in-maps-story-telling-in-an-interesting-avatar
But why annotations?
The dictionary definition of Annotation is: ‘a note by way of explanation or comment added to a text or diagram.’ They have been a part of charts since long, enabling the creator to provide extra useful information to the readers.
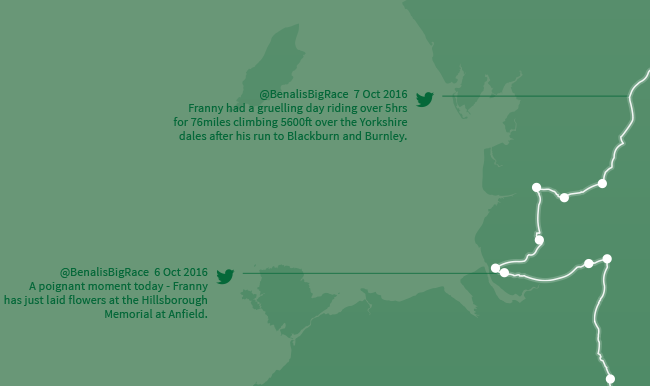
Annotations beautifully guide readers to view certain aspects of the data that are important. They help in adding narratives to guide the audience and offer commentary for a graphic. These narratives help the audience to understand the symbology used in the maps more accurately. These narratives could be any personal anecdote about the place including social media posts.
Cartography reaches a new level with annotations. Annotations in maps allow the map-makers to provide additional details. These details bring in more clarity in understanding the data on maps, removing ambiguity and confusion. If one wants to highlight a particular point or emphasize a key message in the presented data, then annotations can be of great help. These narratives not only add zing to the map but also encourage the audience to compare different data points or highlight a particular range. Including text with graphics, make the graphics self-encapsulating and highly useful on their own. Even sharing and embedding of these graphics is more encouraging as compared to empty graphics.