Seenthis
•
 
Identifiants personnels
  • [mot de passe oublié ?]

 
  • #d
  • #da
  • #dat
  • #data
RSS: #data_science

#data_science

0 | 25
  • @cdb_77
    CDB_77 @cdb_77 14/09/2026
    2
    @kent1
    @stephane_m
    2

    Parlez-moi d’IA – S’initier et comprendre l’intelligence artificielle

    Ils s’appellent #ChatGPT, #Gemini, #Llama, #Midjourney, #Dall-E, #Sora, #Runway, #Claude, #Mistral…

    Tous ces services d’intelligences artificielles génératives, faciles d’accès pour le grand public, ont mis la #data, les #algorithmes, la #data_science sur le devant de la scène. Mais ils ne sont peut-être que les faces émergées et grand public de l’iceberg.

    « Parlez-moi d’IA » est une émission de vulgarisation de la data et de l’IA. Les échanges sont le moins technique possible. Nous cherchons à comprendre et expliquons ce qui change dans nos vies, dans nos métiers, dans notre société avec cette #évolution_technologique. Avec les acteurs au cœur de l’éruption de l’ Intelligence Artificielle dans nos vies, nous tentons de comprendre les enjeux, de décortiquer les #conséquences et d’imaginer une voie des possibles pour une IA d’intérêt général.

    Chaque semaine, pendant 30 minutes, Jean-Philippe Clément, Alexia Toulmet ou Serge Abiteboul reçoit et s’entretient avec une actrice ou un acteur de ce domaine qui partage son actualité, sa vision et ses réflexions. Ils interrogent leurs invités pour mieux décrypter cette évolution technologique majeure, ce nouvel aboutissement d’un monde numérisé !

    Vous voulez comprendre comment la donnée et l’Intelligence artificielle (IA) impactent nos vies ? Vous voulez agir avec ces nouveaux outils et ne pas les subir ? « Parlez-moi d’IA » est une série d’entretiens progressifs et accessibles sur l’usage des #données et de l’intelligence artificielle.

    ▻https://cause-commune.fm/emissions/parlez-moi-d-ia
    #IA #AI #intelligence_artificielle #podcast #audio
    #à_lire #ressources_pédagogiques

    CDB_77 @cdb_77
    Écrire un commentaire
  • @nightingale
    nightingale @nightingale via RSS 17/12/2025

    Analytics Products Will Never Be Truly Human-Centered Until the Workplaces Behind Them Are
    ▻https://nightingaledvs.com/analytics-products-never-human-until-workplaces-are

    I’ve been really excited to see a shift in analytics and business intelligence around the integration of human-centred design, ethics, and accessibility. I learn something..

    #Data_Humanism #Data_Science #Data_Visualization

    nightingale @nightingale via RSS
    Écrire un commentaire
  • @nightingale
    nightingale @nightingale via RSS 14/12/2025

    #Data_Visualization & Affective Computing. Design That Manipulates Emotions or Design That Helps Reflect on Emotions?
    ▻https://dvsnightingale.wpenginepowered.com/data-visualization-affective-computing

    What are emotions and how design is connectedEmotions are complex. They are not feelings nor are they desires. I’ll define emotions as a biopsychological process..

    #Data_Science

    nightingale @nightingale via RSS
    Écrire un commentaire
  • @nightingale
    nightingale @nightingale via RSS 6/11/2025

    #Data_Visualization & Affective Computing. Design That Manipulates Emotions or Design That Helps Reflect on Emotions?
    ▻https://nightingaledvs.com/data-visualization-affective-computing

    What are emotions and how design is connectedEmotions are complex. They are not feelings nor are they desires. I’ll define emotions as a biopsychological process..

    #Data_Science

    nightingale @nightingale via RSS
    Écrire un commentaire
  • @biggrizzly
    BigGrizzly @biggrizzly CC BY-NC-SA 15/05/2025

    Will Landecker: “The winner’s curse” - Mastodon
    ▻https://dair-community.social/@will/114502995247622509

    #ML models tend to give their highest #scores to the #data whose value they #overestimate the most.

    The “#winner’s_curse” is something I wish I had formally learned about much earlier in my career. It haunts us all across machine learning and #data_science: #ranking content, choosing experiment variants, running ad auctions, even the tuning and selection of models themselves. Whenever we use a measurement to help make a selection, we are biasing that measurement.

    The Winner’s Curse in #Machine_Learning
    ▻https://www.accountablealgorithm.com/post/the-winner-s-curse

    An exploration of the Winner’s Curse, how it causes us to overestimate model performance, and what to do about it.

    BigGrizzly @biggrizzly CC BY-NC-SA
    Écrire un commentaire
  • @nightingale
    nightingale @nightingale via RSS 7/01/2025

    Distortion by Design
    ▻https://nightingaledvs.com/distortion-by-design

    Distortion noun /dɪˈstɔːr.ʃən/ — A change to the intended or true meaning of something; a change to the original or natural shape of something; a..

    #Charts #Data_Science #Data_Visualization #math

    nightingale @nightingale via RSS
    Écrire un commentaire
  • @nightingale
    nightingale @nightingale via RSS 7/12/2023

    Exploring Open Source Data to Visualize 99-Cents Stores
    ▻https://nightingaledvs.com/exploring-open-source-data-to-visualize-99-cents-stores

    I used a business database from my public library, free data visualization tools, and art supplies to create a 3D map of 99-cents stores.

    #Data_Art #data_physicalization #Data_Science

    nightingale @nightingale via RSS
    Écrire un commentaire
  • @nightingale
    nightingale @nightingale via RSS 26/10/2023

    Visualizing Emotions with Color Cubes
    ▻https://nightingaledvs.com/visualizing-emotions-with-color-cubes

    Using two different data sets, I leveraged color and 3-D structure to visualize the complexity and breadth of human emotion.

    #Data_Art #Data_Science

    nightingale @nightingale via RSS
    Écrire un commentaire
  • @simplicissimus
    Simplicissimus @simplicissimus 27/09/2023
    4
    @colporteur
    @freakonometrics
    @olaf
    @gastlag
    4

    What Is Data Literacy and Why Is It Important ?

    je pointe ici parce que, pour une fois, au milieu des généralités habituelles sur « la data », il est mentionné, parmi les compétences,
    • la production de données
    • et le nettoyage

    ▻https://www.techrepublic.com/article/what-is-data-literacy

    https://www.techrepublic.com/wp-content/uploads/2022/09/TR-what-is-data-literacy.jpeg

    Data literacy, the ability to read, understand, analyze and communicate information, helps companies make better decisions, improve performance and visualization, and better manage risks and opportunities.
    […]
    What are the important data literacy skills?
    Data types and structures
    Understanding data as it evolves through different stages and data structures is a basic data skill. This involves not only recognizing numeric data from text data or categorical data, but also identifying raw data from data fit for business or data that is poorly formatted, incorrect or outdated.

    How data is structured and stored and knowing where it came from are vital to building comprehensive data inventories and data flow charts, which will serve as the foundation for most data operations.

    Data cleansing
    A business intelligence dashboard that executives and leaders use to make decisions can be a liability if the data used to build it is incorrect. This means selecting raw data that is useful and making sure it is properly formatted and is not incorrect in any way.

    Data generation
    Data generation involves all the processes and endpoints used by a business to collect or create new data. Usually, the first stages of data generation are ripe with raw data. However, when collecting or generating new data, compliance, security and reliability of the data as well as a proper inventory are vital.

    Data analysis
    Data analytics involves recognizing which data is useful for a business goal and selecting that data as a “feature.” There are many automated technologies today that excel in data analytics, including automatic feature engineering.

    However, humans are still vital for data and analytics to work well. Not only must the right data be identified, but it must be correlated with other data; patterns need to be found; and comparisons, conclusions and projections need to be made.

    Data stories
    Using data to tell data stories is a vital data literacy tool. No one wants to see endless Excel sheets during a presentation or read through them in an email. A person may be the most talented analytic expert on a team, but if they cannot use data to tell a story or communicate, connect and engage with others, the value of the data is lost.

    Instead of using tables, data stories use high-impact graphs, visualizations, videos, animations, maps and other elements that make data more engaging and easier to understand.

    Simplicissimus @simplicissimus
    • @monolecte
      Monolecte 😷🤬 @monolecte CC BY-NC-SA 27/09/2023

      J’ai été une data ingénieure sans le savoir.

      J’arrive en CCI, sans formation préalable à la gestion des #données (en dehors de savoir trouver des ref. biblios dans un monde sans internet accessible) et j’ai pratiquement passé deux mois à nettoyer des fichiers excel pour les rendre compatibles avec le logiciel de gestion de contacts qui allait être déployé.

      Ce n’était pas une demande de la hiérarchie : la plupart des gens ne comprenaient pas que si les infos disponibles avaient été entrées à la fouzytout dans un tableur pas prévu pour ça, par des tas de gens qui n’avaient aucune idée de ce qu’ils faisaient, il n’existait aucun moyen automatique pour faire rentrer des roses des sables dans des points.

      Une fois les données normalisées (je ne savais que ça s’appelait comme ça, j’avais juste des listes mal foutues qui ne correspondaient en rien aux champs de la future application), je me suis alors rendues compte qu’elles n’étaient jamais actualisées : autrement dit, les agents entraient des informations, mais n’en sortaient jamais. J’avais un fichier « propre » avec des données bien rangées… et obsolètes.

      Fallait vérifier enregistrement par enregistrement que le gus ou sa boite n’étaient pas en doublon (ça tu pourrais vaguement automatiser), mais aussi pas mort (plein de morts !), déménagé, en faillite, repris.

      Les agents ajoutaient des couches aux couches pour chaque évènement… et même pas toujours au même endroit ni surtout de la même façon.

      Bref, je comprends totalement ce papier.
      Il m’a fallu parfois appeler des agents à la retraite pour comprendre ce qu’ils avaient voulu faire et comment…

      Monolecte 😷🤬 @monolecte CC BY-NC-SA
    • @simplicissimus
      Simplicissimus @simplicissimus 27/09/2023
      @monolecte

      bienvenue @monolecte dans le monde des « vraies données »

      je ne crois pas qu’il y ait réellement un terme spécifique pour décrire cette compétence, de mon côté, sous l’influence de l’INSEE dont l’organigramme a longtemps mentionné une Direction de la production, mais aussi d’Alain Desrosières qui était administrateur de l’INSEE, j’emploie le terme de #production_de_données. Et ce n’est pas forcément ce côté « soutier » qui est mis en valeur quand on parle de #data_science, pas plus qu’il ne l’était quand on parlait de #statistiques …

      ça fait 40 ans que j’interviens dans ce genre de situations ou que je forme des personnes produisant des données…
      dans ce cadre, c’est incroyable le nombre de choses qu’on apprend sur l’organisation effective du travail et l’histoire des organismes ; l’idéal, c’était quand l’équipe chargée du boulot était constituée d’une jeune statisticienne issue d’un IUT STID et d’une employée blanchie sous le harnois , gérant le bouzin depuis 20 ans, après avoir été liquidateur (de feuilles de soins) pendant au moins 10 ans, situation typique des CPAM à l’époque où j’y intervenais. Et oui, étant données les conditions de travail et de rémunération, c’étaient très majoritairement des femmes, aussi bien l’une que l’autre.

      Simplicissimus @simplicissimus
    • @chat
      Chat du Cheshire @chat 29/09/2023

      Chez nous, c’est ce que nous appelons de « l’intendance de la donnée » (traduction de data stewardship).

      Chat du Cheshire @chat
    Écrire un commentaire
  • @nightingale
    nightingale @nightingale via RSS 8/08/2023

    The Best Day… To Buy a #Taylor_Swift Ticket
    ▻https://nightingaledvs.com/the-best-day-to-buy-a-taylor-swift-ticket

    A Taylor Swift fan with little hope of buying a concert ticket used her coding and data viz skills to make her Wildest Dreams come true.

    #Code #Data_Science

    nightingale @nightingale via RSS
    Écrire un commentaire
  • @nightingale
    nightingale @nightingale via RSS 23/12/2022

    FIFA World Cup 2022 – The Network Edition
    ▻https://nightingaledvs.com/fifa-world-cup-2022-the-network-edition

    After a long qualifying process packed with surprises (Italy missing out as the reigning European champions) and last minute drama (both Egypt and Peru missed..

    #Data_Science #Data_Visualization #Network_Graphs #social_network_mapping #sports

    nightingale @nightingale via RSS
    Écrire un commentaire
  • @nightingale
    nightingale @nightingale via RSS 26/10/2022

    Behind the Scenes of “The Future of #Data_Science”: An Interview with Ciera Martinez
    ▻https://nightingaledvs.com/behind-the-scenes-of-the-future-of-data-science-an-interview-with-ci

    A few months ago I had the pleasure of sitting down with Ciera Martinez to discuss the founding of the project, Data Science by #Design,..

    #book #Collaboration #Data_Visualization #Review #Reviews

    nightingale @nightingale via RSS
    Écrire un commentaire
  • @nightingale
    nightingale @nightingale via RSS 13/09/2022

    Game of Thrones — Network of the Dragon
    ▻https://nightingaledvs.com/game-of-thrones-network-of-the-dragon

    One of my first #Data_Science projects was titled, Who Dies Next in the Game of Thrones?—a short article based on my data mining semester..

    #Charts #Data_Visualization #How_To #Network_Graphs #social_network_mapping

    nightingale @nightingale via RSS
    Écrire un commentaire
  • @nightingale
    nightingale @nightingale via RSS 23/08/2022

    #How_To Visualize a Graph with a Million Nodes
    ▻https://nightingaledvs.com/how-to-visualize-a-graph-with-a-million-nodes

    Large-scale graph visualizations are tricky. The more nodes and edges you have in your network, the more difficult it is to compute the layout for..

    #Charts #Cosmograph #Data_Science #Data_Visualization #Network_Graphs #Tools #WebGL

    nightingale @nightingale via RSS
    Écrire un commentaire
  • @nightingale
    nightingale @nightingale via RSS 3/08/2022

    “In the end, all #Data_Visualization ends up with a conversation” — A Joint Review of Eyeo 2022
    ▻https://nightingaledvs.com/in-the-end-all-data-visualization-ends-up-with-a-conversation-a-join

    The Eyeo festival has always held an interesting place in the community as, I’m told, it never really focused on any specific subject matter. At..

    #Career #Data_Art #Data_Humanism #Data_Literacy #Data_Science #Design #New_Voices #Reviews

    nightingale @nightingale via RSS
    Écrire un commentaire
  • @nightingale
    nightingale @nightingale via RSS 15/06/2022

    Remembrances of Things EDA
    ▻https://nightingaledvs.com/remembrances-of-things-eda

    Published for Tukey Day, June 16, the 107th anniversary of John Tukey’s birthThis article recounts the origins and influences of the movement in statistics and data..

    #academia #Community #Data_Science #Data_Visualization #exploratory_data_analysis

    nightingale @nightingale via RSS
    Écrire un commentaire
  • @martin
    Martin @martin PUBLIC DOMAIN 6/05/2022
    1
    @gblin
    1

    Eve Online fans literally cheer Microsoft Excel features at annual Fanfest | Ars Technica
    ▻https://arstechnica.com/gaming/2022/05/eve-onlines-ms-excel-partnership-makes-spreadsheets-in-space-official

    https://cdn.arstechnica.net/wp-content/uploads/2016/08/eve-online-640x360.jpg

    There aren’t many games for which built-in integration with Microsoft Excel would be a major feature whose announcement would draw literal cheers from fans. But Eve Online showed itself to be the exception when developer CCP announced coming Excel integration during its Eve Fanfest keynote this morning.

    Through an official partnership with Microsoft, CCP said it is creating a JavaScript API that will allow players to “seamlessly export data from Eve Online” into the popular spreadsheet program. That “will help players access and calculate everything from profit margins to battle strategy, making day-to-day Eve operations easier to execute,” the company said in a press release.

    “It’s not April fools; this is real,” Eve Online Creative Director Bergur Finnbogason said on the Fanfest stage, receiving bemused laughter in response. “I’m not lying—we actually reached out to [Microsoft] and they were like, ’Oh my god, We love Eve!’”

    #jeux_vidéo #jeu_vidéo #jeu_vidéo_eve_online #ccp #microsoft #microsoft_excel #excel #bergur_finnbogason #tableur #data #données #api #api_javascript #javascript #data_science #larrikin

    Martin @martin PUBLIC DOMAIN
    Écrire un commentaire
  • @nightingale
    nightingale @nightingale via RSS 1/03/2022

    Is there a Happy Ending for the #Peaky_Blinders?
    ▻https://nightingaledvs.com/is-there-a-happy-ending-for-the-peaky-blinders

    Peaky Blinders is an award-winning historical drama series produced by BBC Studios. The show is set between the two world wars and is centered around..

    #Data_Science #Data_Visualization #How_To #social_network_mapping #Tools

    nightingale @nightingale via RSS
    Écrire un commentaire
  • @nightingale
    nightingale @nightingale via RSS 4/11/2021
    2
    @fil
    @02myseenthis01
    2

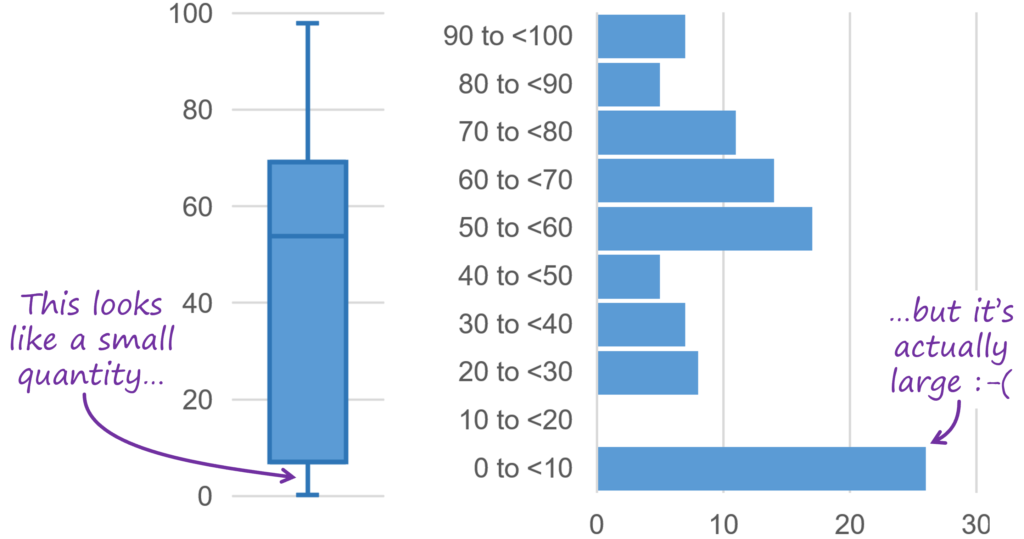
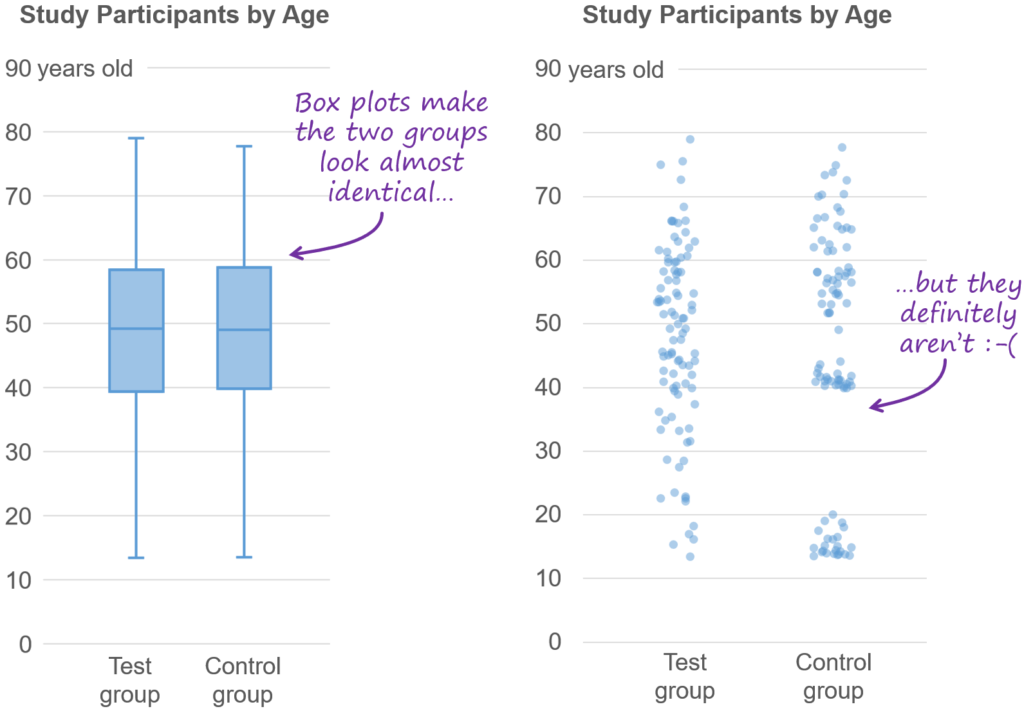
    I’ve Stopped Using #box_plots. Should You?
    ▻https://nightingaledvs.com/ive-stopped-using-box-plots-should-you

    tl;dr: After having explained #How_To read box plots to thousands of workshop participants, I now believe that they’re poorly conceived (box plots, not workshop..

    #Business_Intelligence #Charts #Data_Science #Data_Visualization #statistics

    nightingale @nightingale via RSS
    • @simplicissimus
      Simplicissimus @simplicissimus 4/11/2021

      ben oui, c’est bien connu de longue date, la #boîte_à_moustaches ne peut avoir de sens que pour une distribution unimodale, ce qui fait une hypothèse implicite très forte sur ses conditions d’utilisation.

      Le premier exemple présenté…

      https://nightingaledvs.com/wp-content/uploads/2021/11/box-plot-vs-histogram-w-callouts-1024x539.png

      … et tous les suivants ont cette même caractéristique : il y a plusieurs modes (sommets relatifs) dans la distribution

      https://nightingaledvs.com/wp-content/uploads/2021/11/box-plot-vs-strip-plots-1024x709.png

      Simplicissimus @simplicissimus
    • @fil
      Fil @fil 5/11/2021

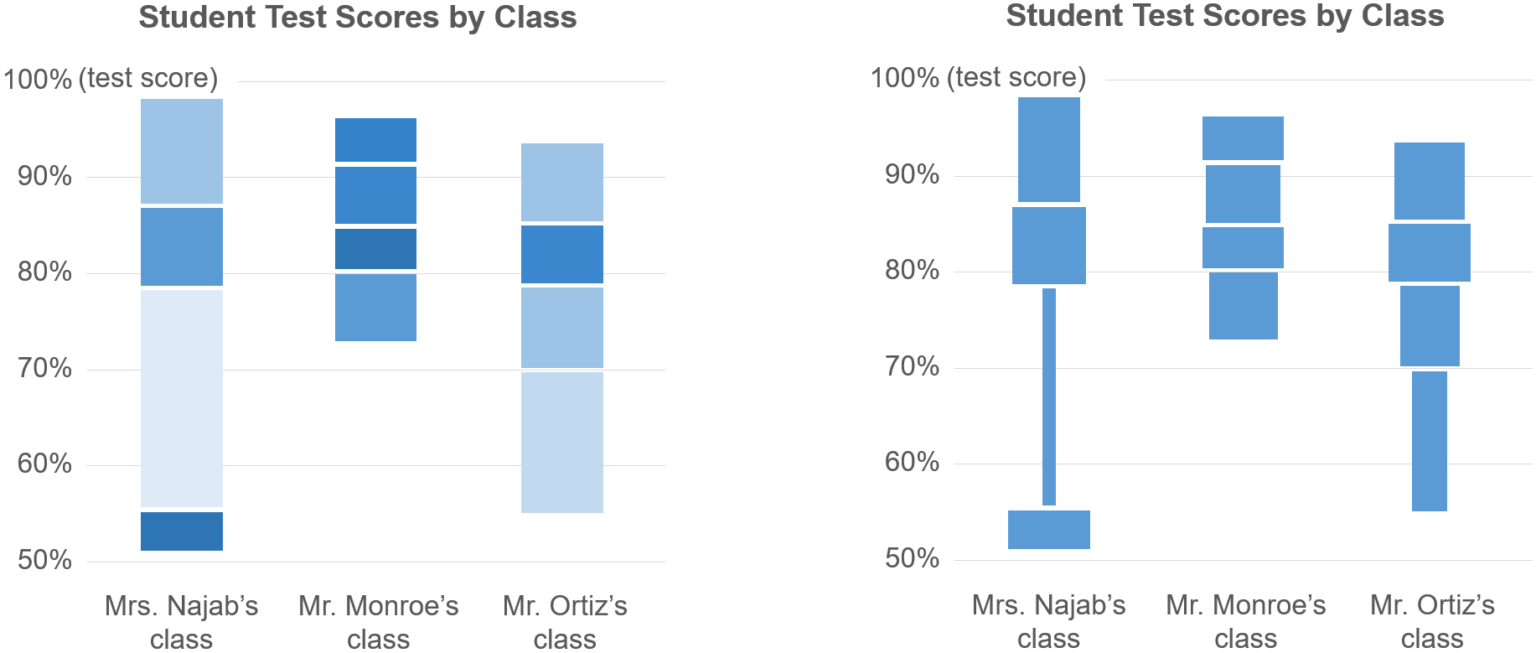
      il propose des alternatives

      https://nightingaledvs.com/wp-content/uploads/2021/11/alternative-quartile-concepts-1536x653.png

      Fil @fil
    • @simplicissimus
      Simplicissimus @simplicissimus 5/11/2021

      Oui, la version de gauche est intéressante et… un peu technique à réaliser. Perso, les graphiques avec les points individuels, éventuellement bruité (jittered strip plot, celui de droite dans le deuxième exemple cité ci-dessus) me parait convenir parfaitement : plus directement lisible et pas vraiment compliqué techniquement à réaliser, surtout avec un petit nombre d’individus, comme c’est le cas pour les exemples d’alternatives)

      Simplicissimus @simplicissimus
    Écrire un commentaire
  • @nightingale
    nightingale @nightingale via RSS 4/08/2021

    Aurora Speeding Tickets
    ▻https://nightingaledvs.com/aurora-speeding-tickets

    Before smartphones, digital cameras, and orbiting satellites, the international scientific community recruited volunteer observers across the globe to record and report aurora borealis activity as..

    #astronomy #citizen_science #Data_Science #Data_Visualization #Historic_Dataviz #qualitative_research #Tools

    nightingale @nightingale via RSS
    Écrire un commentaire
  • @nightingale
    nightingale @nightingale via RSS 15/06/2021

    Using Infographics to Make #climate_change More Visible to the Public
    ▻https://nightingaledvs.com/using-infographics-to-make-climate-change-more-visible-to-the-public

    Climate change may not be a directly observable phenomenon, but its impacts are currently threatening the lives of all living organisms. Although the majority of..

    #Charts #Data_Science #Data_Visualization #Design #engagement #environment #How_To #interactive_dataviz

    nightingale @nightingale via RSS
    Écrire un commentaire
  • @hlc
    Articles repérés par Hervé Le Crosnier @hlc CC BY 12/11/2019
    1
    @monolecte
    1

    E.P.A. to Limit Science Used to Write Public Health Rules - The New York Times
    ▻https://www.nytimes.com/2019/11/11/climate/epa-science-trump.html

    https://static01.nyt.com/images/2019/11/11/climate/00CLI-EPASCIENCE1/00CLI-EPA1-facebookJumbo.jpg

    WASHINGTON — The Trump administration is preparing to significantly limit the scientific and medical research that the government can use to determine public health regulations, overriding protests from scientists and physicians who say the new rule would undermine the scientific underpinnings of government policymaking.

    A new draft of the Environmental Protection Agency proposal, titled Strengthening Transparency in Regulatory Science, would require that scientists disclose all of their raw data, including confidential medical records, before the agency could consider an academic study’s conclusions. E.P.A. officials called the plan a step toward transparency and said the disclosure of raw data would allow conclusions to be verified independently.

    For instance, a groundbreaking 1993 Harvard University project that definitively linked polluted air to premature deaths, currently the foundation of the nation’s air-quality laws, could become inadmissible. When gathering data for their research, known as the Six Cities study, scientists signed confidentiality agreements to track the private medical and occupational histories of more than 22,000 people in six cities. They combined that personal data with home air-quality data to study the link between chronic exposure to air pollution and mortality.

    But the fossil fuel industry and some Republican lawmakers have long criticized the analysis and a similar study by the American Cancer Society, saying the underlying data sets of both were never made public, preventing independent analysis of the conclusions.

    “It was hard to imagine that they could have made this worse, but they did,” said Michael Halpern, deputy director for the Center for Science and Democracy at the Union of Concerned Scientists, a nonprofit advocacy group. He added, “This is a wholesale politicization of the process.”

    Academics are not typically required to turn over private data when submitting studies for peer review by other specialists in the field, or for publication in scientific journals, the traditional ways scientific research is evaluated. If academics were to turn over the raw data to be made available for public review, the E.P.A. would have to spend hundreds of millions of dollars to redact private information, according to one federal estimate.

    #Santé #Données_personnelles #EPA #Politique_scientifique #Data_science #Manipulation

    Articles repérés par Hervé Le Crosnier @hlc CC BY
    Écrire un commentaire
  • @fil
    Fil @fil 29/07/2015
    1
    @touti
    1
    @archiloque

    Let’s Make Gender Diversity in #Data_Science a Priority Right from the Start - PLOS Biology
    ▻http://journals.plos.org/plosbiology/article?id=10.1371/journal.pbio.1002206

    Ten Simple Rules for Increasing Gender Diversity in Data Science

    Get data science culture right at our places of employment:

    1 Foster a recruitment process that seeks out diverse candidate pools and engages in targeted and intentional outreach efforts that attract a diverse applicant pool.
    2 Monitor and promote pay equity.
    3 Develop organizational mechanisms for promoting diversity in which success of such efforts can be measured and rewarded.
    4 Provide leadership opportunities for women, promote their efforts, and help women identify advancement opportunities.
    5 Make diversity a strategic priority and expect those who work for and/or with us to do so as well.

    Become an activist for women’s representation in data science:

    6 Put women colleagues and students up for awards and recognitions. Share their work with colleagues. Provide mentorship that helps them navigate the pathways to success. Help clear those paths.
    7 Raise awareness of diversity. If you are asked to present, be on a panel, or serve on a committee, ask if there are (other) women participating. If not, suggest names of women to invite. (Bonus points for not accepting the response that finding good women candidates is hard.) This approach is particularly effective when both men and women ask these questions.
    8 Help create positive language and social expectations around data science: assume that women will be part of the process and part of the leadership. Spread the word that women’s leadership belongs in data science. Position and highlight the expertise of women in the field and include their voices.
    9 Send colleagues and students to the Grace Hopper Celebration of Women (and go yourself). Encourage them to utilize this meeting to expand their networks, advance their professional success, and develop mentors, colleagues and friends in data science.
    10 Focus on daily actions and interactions. Make sure that women’s contributions are valued and heard. Model inclusive behavior and hold yourself and others accountable.

    ping @archiloque #femmes #informatique

    Fil @fil
    Écrire un commentaire
  • @lyco
    Lyco @lyco 11/03/2014
    1
    @baroug
    1

    Un mathématicien pour fidéliser les abonnés du #New_York_Times
    ▻http://www.telerama.fr/medias/un-biologiste-pour-fideliser-les-abonnes-du-new-york-times,109590.php

    Le recrutement d’un expert tel que Wiggins, s’il semble donc logique, ne constitue pas une première dans la presse américaine : en octobre 2013 déjà, le Wall Street Journal avait débauché de l’université Columbia une certaine Rachel Schutt, chercheuse en « #data_science » et rompue elle aussi à l’élaboration de modèles informatiques de #prédiction. Et il est probable que d’autres journaux fassent de même rapidement. Car jusqu’ici, dans la presse, les données de navigation des internautes n’étaient utilisées principalement qu’en temps réel, à des fins d’optimisation de la viralité des contenus, ou par les annonceurs publicitaires. Avec l’arrivée de ces prédicteurs, chargés d’anticiper le désamour des abonnés, la presse entre dans une nouvelle ère des possibles, à la Minority Report : pouvoir devancer l’inéluctable, et le contrer.

    #presse #web #nyt

    • #New York Times
    • #Wall Street Journal
    Lyco @lyco
    • @baroug
      baroug @baroug 11/03/2014

      #plo

      baroug @baroug
    Écrire un commentaire
  • @fil
    Fil @fil 8/05/2013
    3
    @reka
    @baroug
    @simplicissimus
    3

    The Unreasonable Effectiveness of Data Scientists
    ▻http://bigdatasc.wordpress.com/2013/05/08/the-unreasonable-effectiveness-of-data-scientists

    In 2009, Google released a paper titled The Unreasonable Effectiveness of Data and though I agree with most of it, I would argue that the effectiveness comes first and foremost from the data scientists themselves. (...)

    #data_science is a great tool to have in a company’s toolbelt and can have a disproportionate impact on its achievements. Great data scientists understand the business needs of a company, use data to find the best solution and make this solution a reality.

    • #Google
    Fil @fil
    Écrire un commentaire
0 | 25

Thèmes liés

  • #data_science
  • #data_visualization
  • #charts
  • #how_to
  • #data
  • #données
  • #data_art
  • #network_graphs
  • #social_network_mapping
  • #design
  • #tools
  • #data_humanism
  • #reviews
  • #prédiction