
Reform Berliner Bundestagswahlkreise : Wahlsieger am Reißbrett
▻https://taz.de/Reform-Berliner-Bundestagswahlkreise/!5895527
La nouvelle repartition des circonscriptions électorales à Berlin éliminera les candidats du parti de gauche. Avec le même nombre de voix qu’au dernières élections Die Linke n’obtiendra plus aucun député au Bundestag. En 2025 il lui faudra impérativement dépasser le seuil de cinq pour cent des voix électorales au niveau national pour entrer au Bundestag.
L’Allemagne impose un résultat d’au moins cinq pourcent des voix électorales comme condition d’entrée dans ses parlements politiques.
Une règle du droit de vote allemand veut qu’à partir de trois élus par vote majoritaire le nombre des autres délégués du parti se calcule proportionellement même si son résultat général est en dessous de cinq pour cent.
Actuellement Die Linke profite de cette règle.
Dans toutes les élections politiques allemandes sont élus deux candidats par circonscription. Le premier est élu par vote majoritaire dans un seul tour, alors que le deuxième vote de chaque électeur entre dans le calcul proportionnel au niveau global. Chaque parti y propose une liste de candidats qui entrent au parlement en fonction de leur position sur la liste du parti et des voix obtenus.
Ce double vote rend nécessaire des calculs compliqués afin de garantir la bonne repartition proportionelle des sièges. Il a fait gonfler le Bundestag au point où il est devenu le deuxième grand parlement du monde après le congrès national de Chine.
Ce développement est la raison officielle pour les modifications à venir des circonscriptions. A Berlin le parti sicialdémocrate SPD domine la commission chargé de la conception des circonscriptions. Elle propose alors au parlement une nouvelle repartition qui augmentera le nombre des socialdémocrates élus par vote majoritaire. Les perdants seront les chrétiens-démocrates et surtout le parti de gauche.
Erik Peter - Die Linke wirft der SPD vor, die Wahlkreise für die Berliner Bundestagswahl zu ihren Gunsten zuzuschneiden. Auch Grüne und CDU würden verlieren.
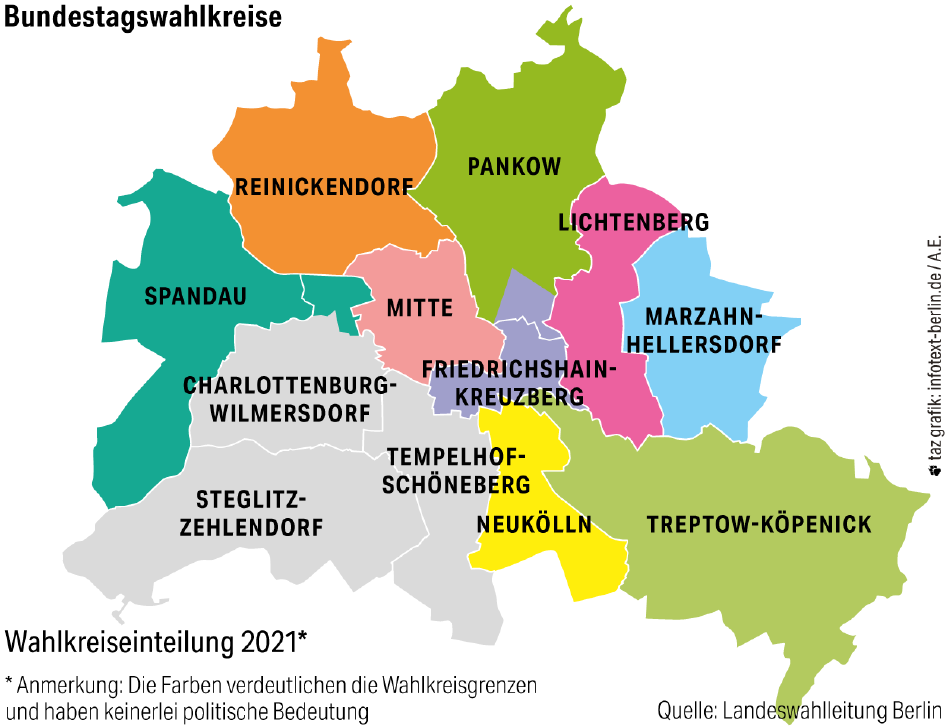
BERLIN taz | Die Reform der Berliner Bundestagswahlkreise vor der kommenden Wahl 2025 könnte vor allem der SPD zum Vorteil gereichen. Linken, Grünen und CDU droht dagegen der Verlust bisheriger Mandate. Das ergibt sich aus zwei alternativen Vorschlägen der Landeswahlleiterin an die Wahlkreiskommission des Bundestags, die der taz vorliegen. Hintergrund ist die für eine angestrebte Verkleinerung des Bundestages notwendig gewordene Verringerung von bislang 12 auf zukünftig 11 Berliner Wahlkreise.
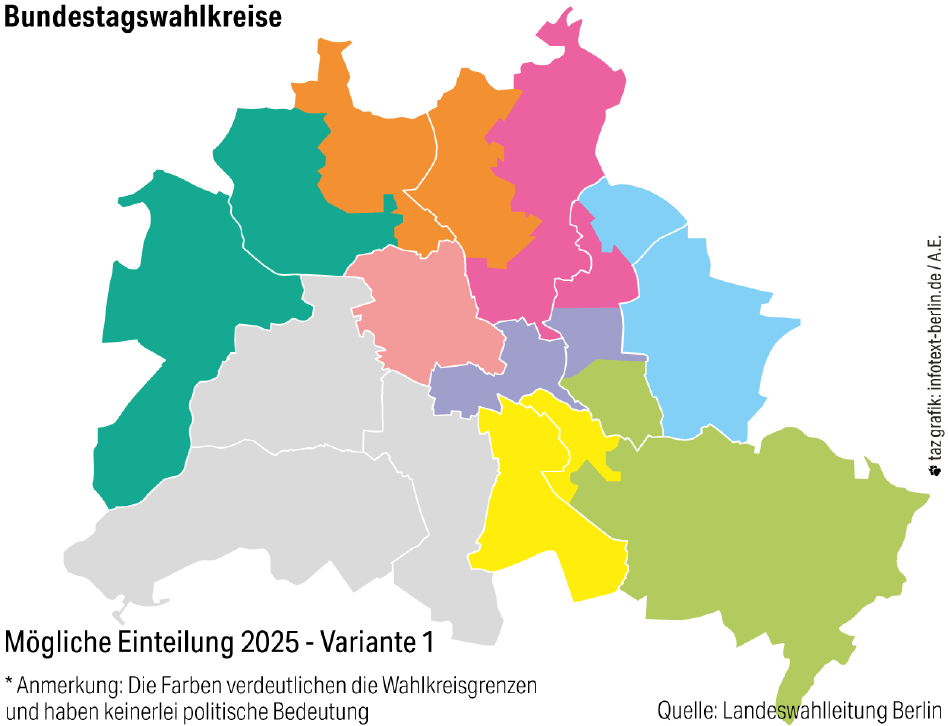
Eine erste Variante sieht vor, den 2021 von den Linken gewonnenen Wahlkreis Lichtenberg aufzulösen und auf umliegende Wahlkreise zu verteilen. Das Mandat entfiele ersatzlos. Der Vorschlag treibt insbesondere die Linke um: Bedroht wäre schließlich eines von drei bundesweiten Direktmandaten, das der Partei zuletzt gerade so den Fraktionsstatus im Bundestag gesichert hat. Auch die CDU hätte bei dieser Variante das Nachsehen und könnte ihr Direktmandat in Reinickendorf an die SPD verlieren.
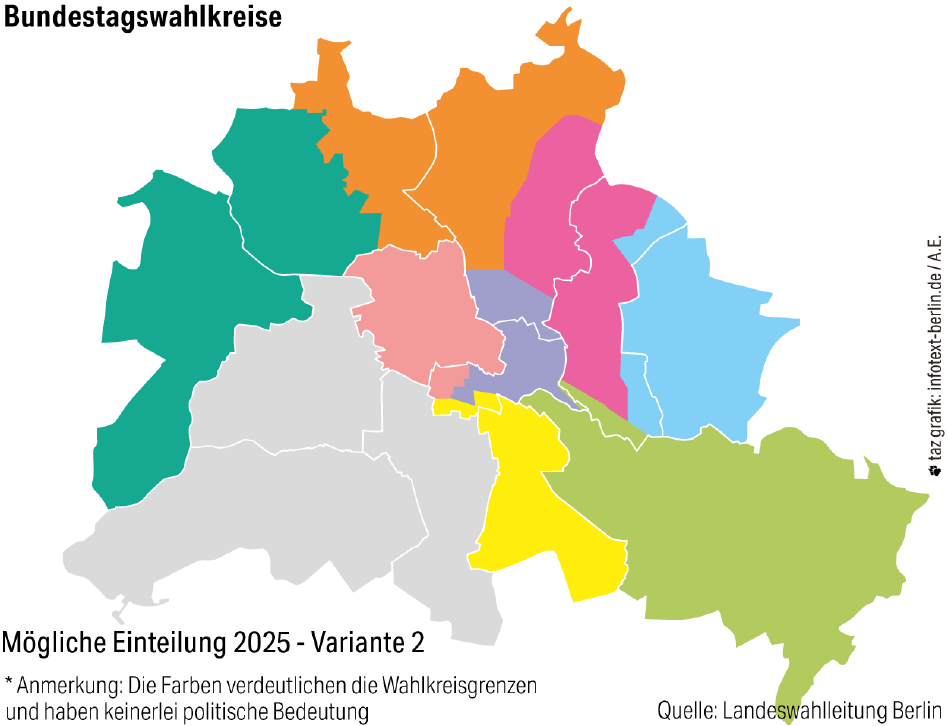
Ein anderer, von der Landeswahlleitung favorisierter Vorschlag sieht die Aufteilung des Wahlkreises Pankow sowie Umverteilungen in Reinickendorf und Spandau vor. Bei diesem Vorschlag würden die Grünen ihr in Pankow gewonnenes Mandat ersatzlos verlieren und wiederum die SPD einen Wahlkreis gewinnen, der bisher an die CDU fiel.
In beiden Varianten wäre also die SPD die große Gewinnerin. Holte sie bei der Wahl 2021 noch 4 von 12 Berliner Bundestagswahlkreisen direkt, wären es bei gleichbleibender Stimmenverteilung zukünftig 5 von 11.
Die vorgeschlagenen Neufassungen gehen auf die turnusgemäßen Prüfungen der Wahlbezirke zurück. Die Landeswahlleitungen müssen dafür Vorschläge an die Wahlkreiskommission des Bundestages übermitteln. Diese legt im Januar ihre Vorschläge dem Bundestag vor, der dann final entscheidet. Grundsätzlich gilt, dass alle Wahlkreise ähnlich groß sein sollen und nicht mehr als 15 Prozent von der durchschnittlichen Wahlkreisgröße (rund 250.000 Wahlberechtigte) abweichen sollen.
In Berlin liegen derzeit zwei Wahlkreise deutlich unter dem Schnitt: Spandau-Charlottenburg-Nord (–16,8 Prozent) und Reinickendorf (–18,6 Prozent). Erstaunlich scheint angesichts dessen, dass bei den vorliegenden Vorschlägen von Landeswahlleitung und Innenverwaltung die Schere auch in Pankow und Lichtenberg angesetzt wird.
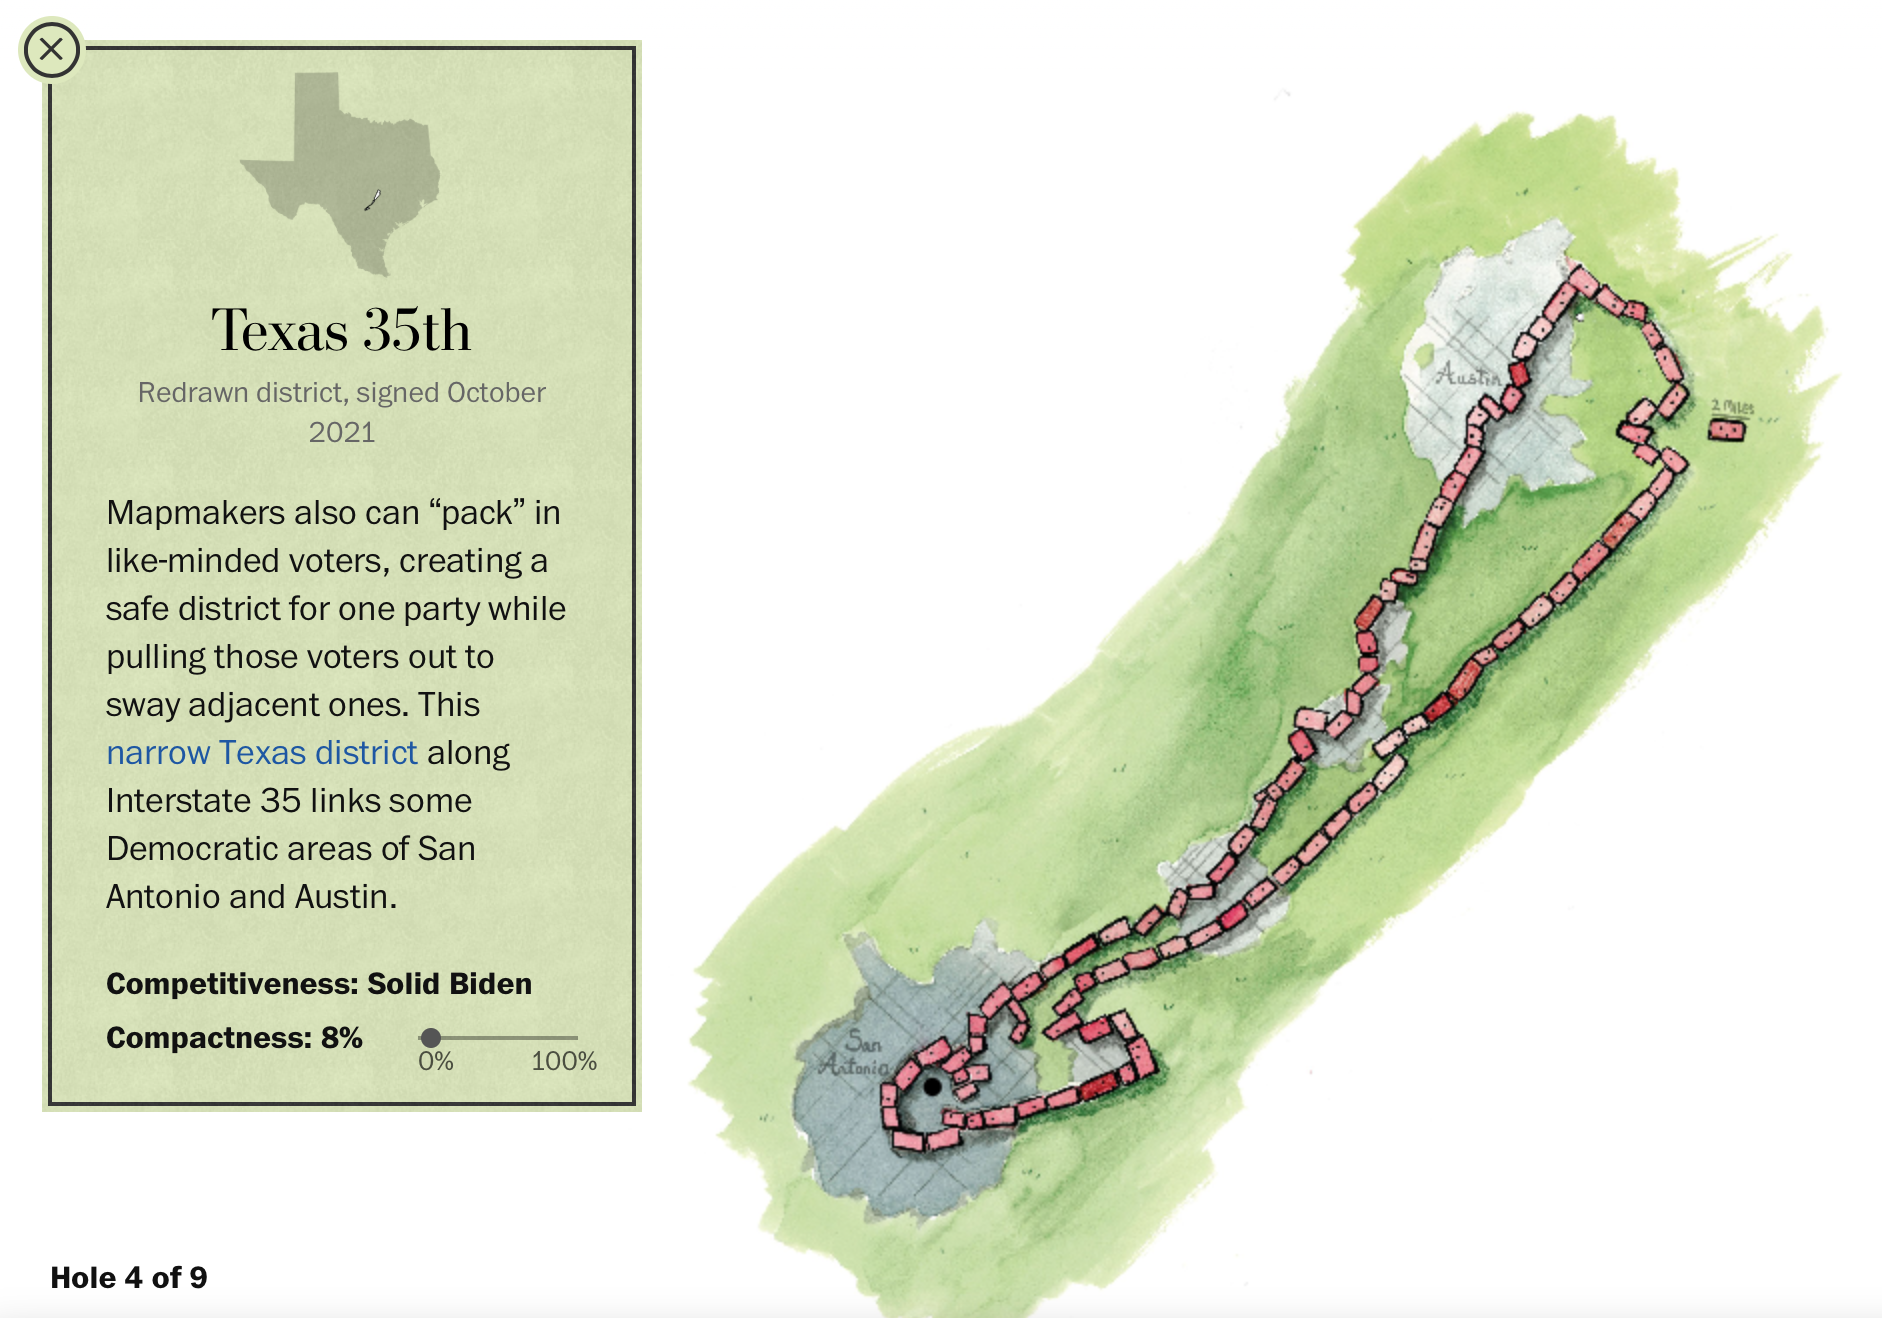
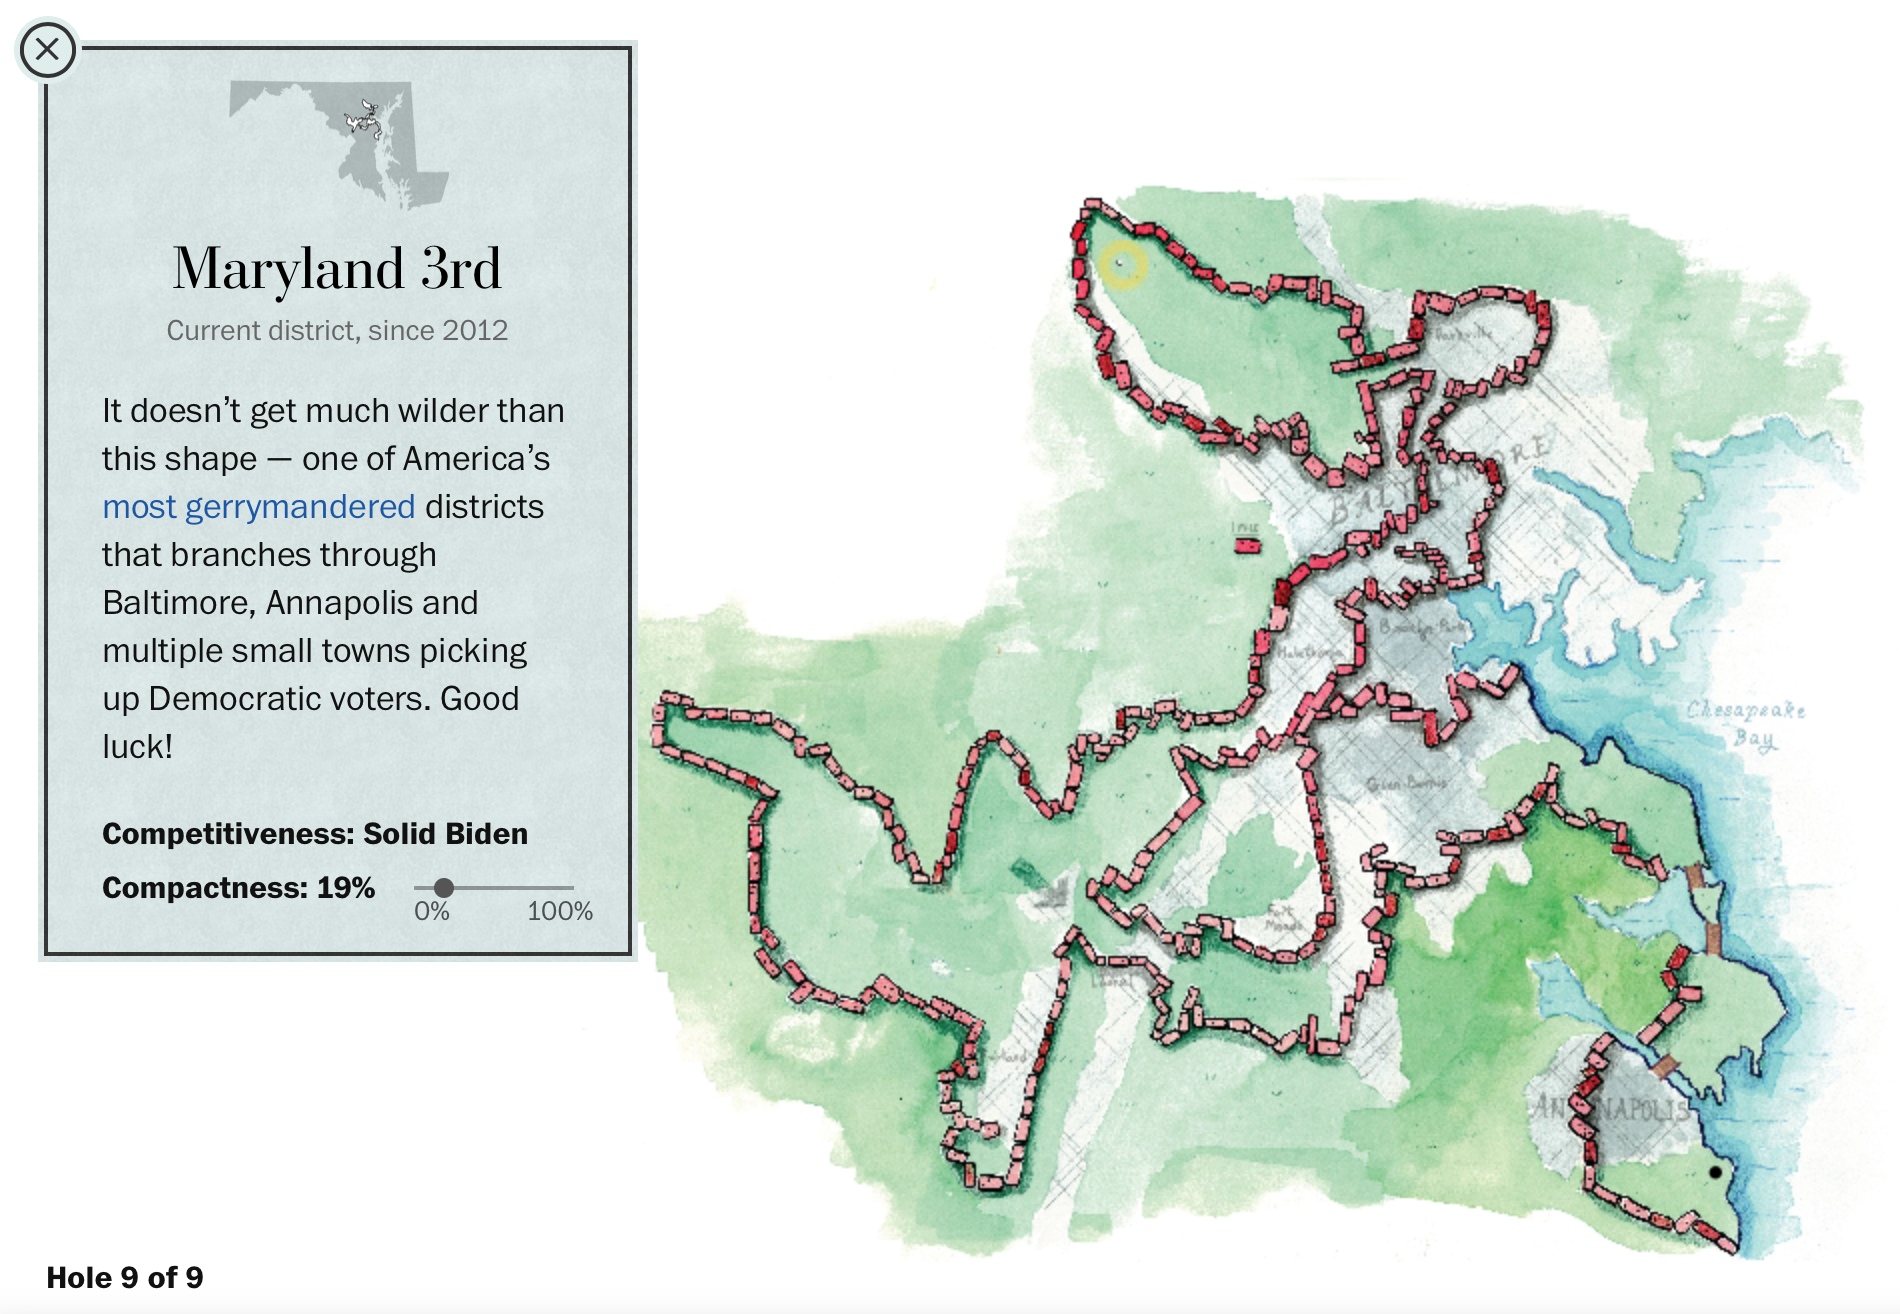
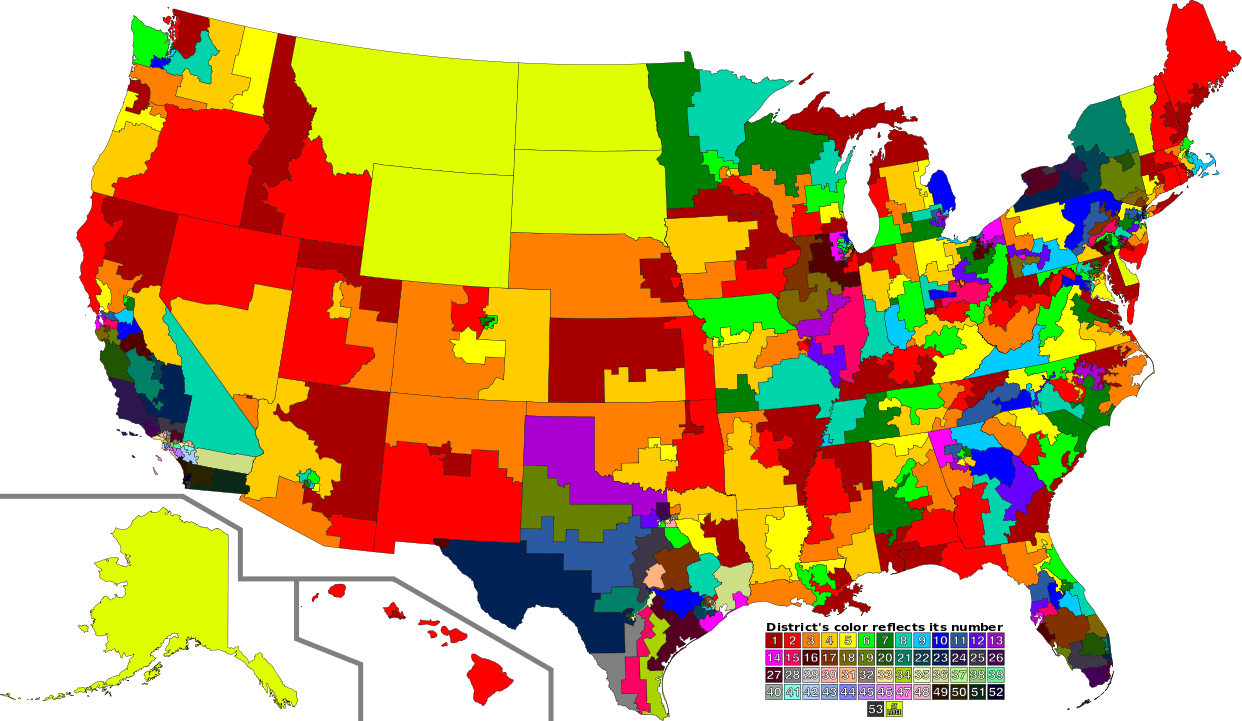
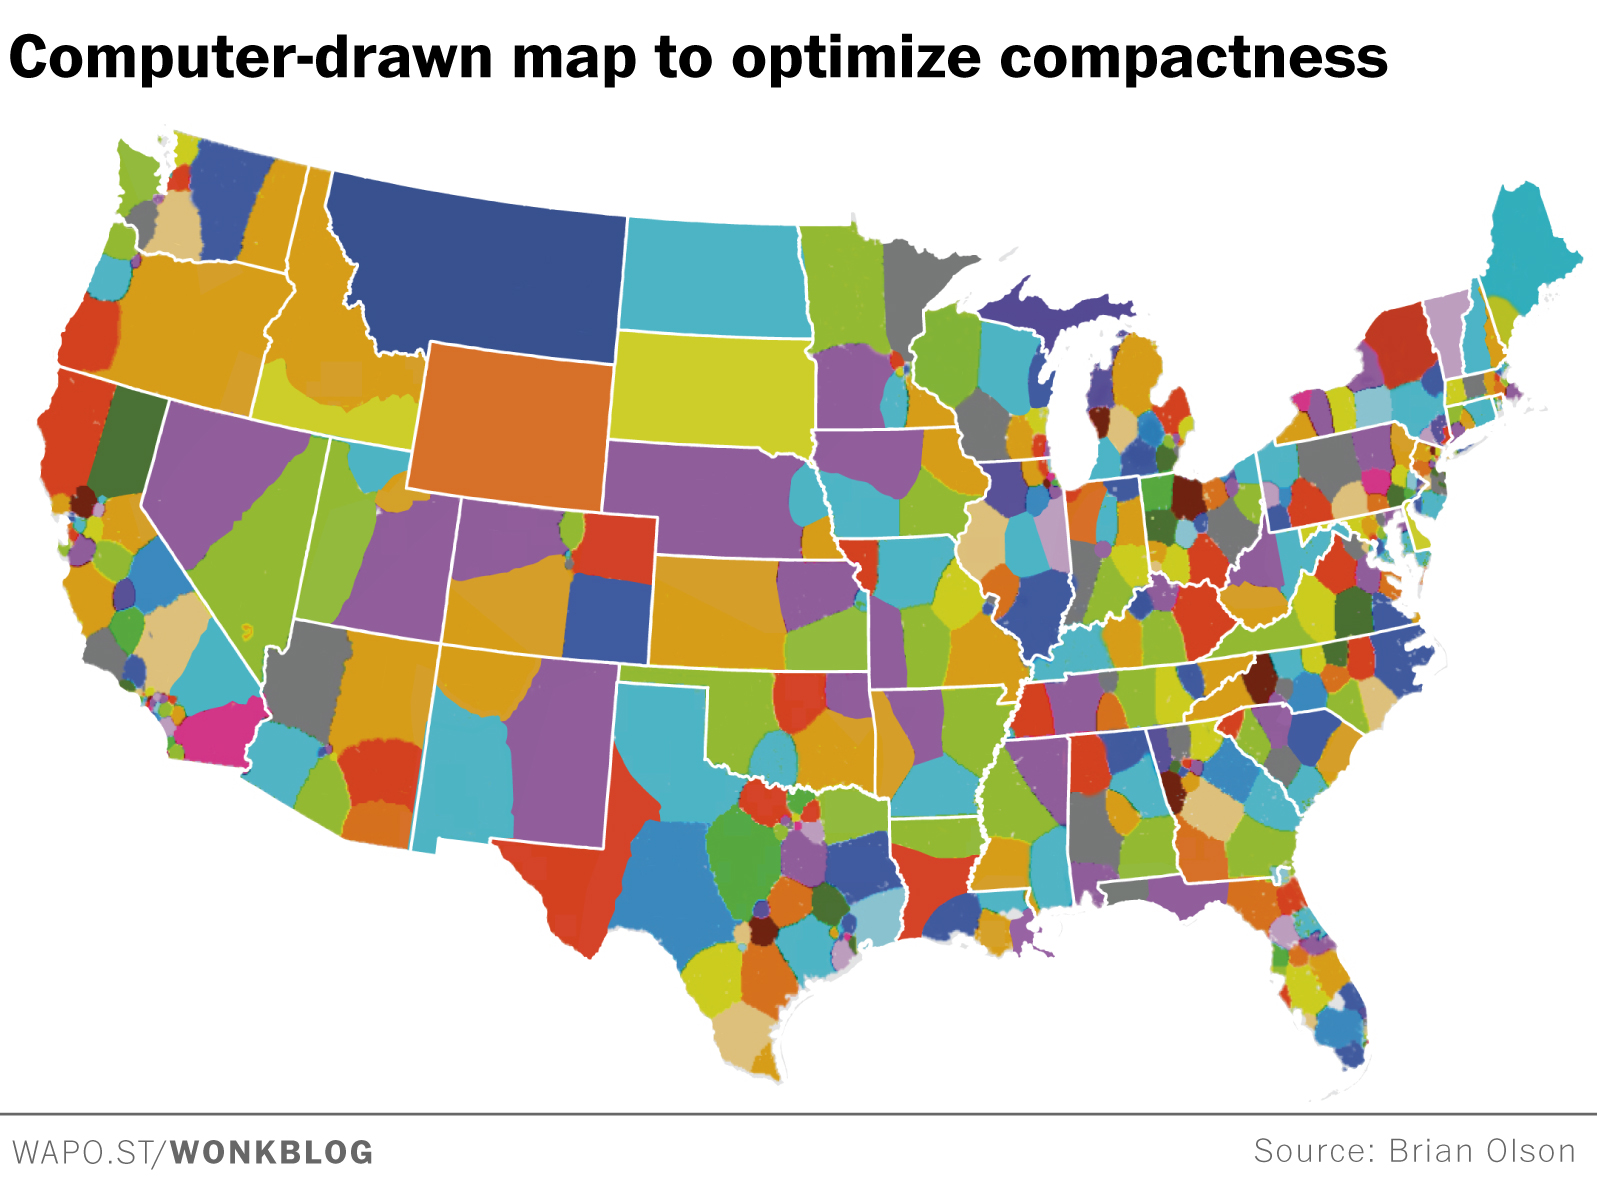
Entsprechend sind die Vorschläge außerhalb der SPD nicht gerade gut angekommen. Bei den Grünen hat man Bauchschmerzen. Und der Berliner Linken-Abgeordnete Sebastian Schlüsselburg wirft der als Innenverwaltung verantwortlichen SPD gleich „Gerrymandering“ (siehe Kasten) vor: Mit dem im englischen Sprachgebrauch gebräuchlichen Begriff wird die vor allem aus den USA bekannte Unsitte bezeichnet, Wahlkreiszuschnitte für Parteipolitik zu missbrauchen.
„Beide Varianten sind offensichtliche Fälle von Gerrymandering“, sagt Schlüsselburg, „es gibt kein sachliches Argument, warum Lichtenberg als dynamischer und wachsender Wahlkreis kein eigener Wahlkreis bleiben sollte.“ Die mangelnde Größe Charlottenburg-Nords und Reinickendorfs sollte seiner Ansicht minimalinvasiv vor Ort korrigiert werden.
Schlüsselburg kritisiert zudem, dass die Innenverwaltung von Iris Spranger (SPD) die Vorschläge aus dem Juli den Parteien erst Mitte November vorlegte – mit gerade einmal einer zweiwöchigen Frist zur Stellungnahme. „Wahlkreiszuschnitte in Hinterzimmern beschädigen das Vertrauen in die Demokratie“, sagt Schlüsselburg, „die SPD und die Landeswahlleitung müssten nach der von ihr verantworteten Wahlwiederholung eigentlich das Vertrauen in die Wahldemokratie stärken – dann aber versuchen sie, den Volksentscheid von der Abstimmung zu trennen, und überraschen uns nun mit kurzer Fristsetzung beim Neuzuschnitt der Wahlkreise.“ Die Linke hat die Vorschläge in ihrer Stellungnahme entsprechend kritisiert und abgelehnt. Sie spricht sich für die zweite Variante mit Änderungen aus und will den Wahlkreis Lichtenberg und Pankow weitgehend unangetastet lassen.
Die SPD teilte der taz mit, Vorschläge der Wahlkreiskommission zur Kenntnis genommen und keine Stellungsnahme abgegeben zu haben. Die Innenverwaltung äußerte sich auf taz-Anfrage dazu bislang nicht.
Erinnerung an PDS-Zeiten
Der Linken könnte damit ein ähnliches Szenario wie der Vorgängerpartei PDS drohen. Nachdem diese 1998 noch vier Direktmandate im Osten Berlins gewonnen hatte, blieben ihr nach der Neuaufteilung der Wahlkreise vor der Bundestagswahl 2002 nur noch zwei sichere Wahlkreise übrig. Weil die Partei dann knapp an der 5-Prozent-Hürde scheiterte, zogen damals nur noch Gesine Lötsch in Lichtenberg und Petra Pau in Marzahn-Hellersdorf als direkt gewählte Abgeordnete in den Bundestag ein – eine PDS-Fraktion gab es nicht mehr.
Abgeschafft worden waren zuvor die Wahlkreise Hohenschönhausen-Pankow-Weißensee, mit der Folge, dass die Partei im neuen Wahlkreis Pankow ins Hintertreffen geriet. Keine Chance mehr hatte die PDS zudem im neu zusammengesetzten Ost-West-Wahlkreis Mitte, nachdem sie zuvor den alten Wahlkreis Mitte-Prenzlauer Berg dominiert hatte. Die PDS war damit die einzige große Verliererin der damaligen Wahlkreisreform.
Parallel zur turnusmäßigen Prüfung der Wahlkreise arbeitet die Bundesregierung derzeit an einer grundlegenden Reform des Wahlrechts, um den durch Überhangmandate überdimensionierten Bundestag zu verkleinern. Sollte diese kommen, könnten die nun diskutierten Wahlkreiszuschnitte wiederum Makulatur sein.
#Berlin #Allemagne #politique #gauche #Die_Linke #élections #Bundestag #droit #Überhangmandat #gerrymandering


:no_upscale()/cdn.vox-cdn.com/uploads/chorus_asset/file/8560707/north_carolina_congresional_district.jpg)
:no_upscale()/cdn.vox-cdn.com/uploads/chorus_asset/file/16681116/Screen_Shot_2019_06_27_at_9.58.48_AM.png)


/cdn.vox-cdn.com/uploads/chorus_asset/file/9976051/map.png)
/cdn.vox-cdn.com/uploads/chorus_asset/file/9970043/concept.png)


