• A New Tool Allows Researchers to Track Damage in #Gaza

    As the Israel Defense Forces (IDF) continue to bomb the Gaza Strip, many researchers are attempting to track and quantify the damage to the territory’s buildings, infrastructure and the displacement of the local population.

    A new tool, originally developed to estimate damage in Ukraine, has now been adapted and applied to Gaza. The tool can estimate the number of damaged buildings and the pre-war population in a given area within the Gaza Strip.

    The tool has already been used by a number of media outlets, but it is freely available for anyone to use and we have outlined its key features below.

    The coloured overlay on this map is a damage proxy map indicating the probability of a significant change occurring at particular locations since October 10, 2023. Users can click the “draw polygon” button to draw an area of interest on the map — for example, a particular neighbourhood.

    To understand how the tool works, let’s look at the neighbourhood of Izbat Beit Hanoun, which sustained heavy damage visible in these high-resolution, before-and-after satellite images from Planet:

    The row of apartment complexes in the north of the neighbourhood near the road has been razed. Lower-density areas in the centre and northeast of the neighbourhood have also sustained heavy damage. Airstrikes have also destroyed several of the apartment complexes in the southwest.

    Below is the damage probability map generated by the tool, highlighting many of these areas:

    Drawing a box over this neighbourhood allows us to roughly quantify the number of buildings – and people- affected by the destruction.

    In the neighbourhood of Izbat Beit Hanoun, the tool estimates that there are 321-425 damaged buildings (73 — 97%), displayed with colours above. The tool also estimates that in the area of interest there was a pre-war population of 7,453, of which 4756 – 6304 lived in areas that are now likely to be damaged.
    How it Works

    Synthetic Aperture Radar (SAR) imagery has been used extensively in academic studies of building damage, and by groups like NASA following the 2020 explosion at the port of Beirut. NASA explains the use of SAR for building damage detection as follows: “SAR instruments send pulses of microwaves toward Earth’s surface and listen for the reflections of those waves. The radar waves can penetrate cloud cover, vegetation, and the dark of night to detect changes that might not show up in visible light imagery. […] When buildings have been damaged or toppled, the amplitude and phase of radar wave reflections changes in those areas and indicate to the satellite that something on the ground has changed.”

    The application above detects damaged areas by measuring the change in the intensity of the radar waves reflected back to the Sentinel-1 satellite before and after October 10, 2023, adjusted for how noisy the signal is in both periods. A more detailed explanation of the algorithm (which was peer-reviewed for a conference) is available here, and a walkthrough (including code) applied to the 2020 Beirut explosion is available here.

    Once likely damaged areas have been identified, the damage probability map is combined with building footprints from Microsoft. Footprints in which significant change has occurred are classified as damaged. This yields a count (and proportion) of estimated damaged buildings within an area.

    To get a rough idea of the number of people affected in a given area, population data are sourced from the LandScan program at Oak Ridge National Laboratory. The data are provided at the level of 90 metres. These population estimates are generated by merging current data on building structures, occupancy rates and infrastructure. Because these are estimates, they are subject to some level of error. They also predate the current conflict and are thus not meant to be interpreted as a count of actual or potential civilian casualties. You can read more about LandScan data here.
    Accuracy

    To assess the accuracy of the damage detection algorithm, damage points from the UN Satellite Office (UNOSAT) were used for validation. These are generated by manually combing through high-resolution satellite imagery and tagging visibly damaged buildings. Below is the same image of Izbat Beit Hanoun, with UNOSAT damage points overlaid in white.

    In the images above, the colourful overlay is a damage probability map. Darker colours indicate a higher probability that a significant change occurred after October 10, 2023.

    The UNOSAT damage points are available under the “Layers” tab in the top right corner of the tool. It should be noted that UNOSAT carried out the assessment on November 7 and that damage has occurred since then.

    Geolocated Footage

    To get an additional source of validation data, geolocated footage of strikes and destruction in Gaza are available under the “Layers” tab in the top right, and are displayed as blue triangles.

    These are sourced from Geoconfirmed, a community-based geolocating network. Clicking on a geolocated event will open a panel in the top right, showing a brief description of the event, the date, a link to the source media, and a link to the geolocation of the event.

    In the example below, clicking on a geolocated event in the heavily damaged Tal al-Hawa neighbourhood reveals that Gaza City’s International Eye Hospital appears to have been hit by an airstrike.

    Clicking on “Source Media” shows the following image of the eye hospital.

    Clicking on “Geolocation” displays the following tweet, which uses the visible characteristics of the building itself and adjacent buildings to locate the picture.

    Further research confirms that the International Eye Hospital was subsequently completely destroyed.

    It should be noted that the geolocations have not been independently verified by the creators of the tool and are automatically added to the map as they become available. Nevertheless, these geolocations are an important additional source of preliminary information. As of the date of publication, there were 541 geolocated events in the Gaza Strip. The tool automatically adds new geolocations as they become available.
    Important Caveats

    While this tool can help us better understand the devastating impact of IDF strikes on Gaza, there are a number of important caveats to bear in mind when using it.

    The first is that this tool detects any significant changes that have occurred in Gaza since October 10, 2023. The vast majority of these changes are likely related to conflict damage, but not all. For example, placing a large number of tents on a previously open field would be detected, since this would change the amplitude of the signal reflected back to the Sentinel-1 satellite from that patch of land.

    Second, because of the way the algorithm functions, older damage will be more confidently detected than newer damage. Thus, while the tool updates automatically as new imagery becomes available, it may take some time for newer damage to become visible. Other SAR-based methods can produce accurate estimates of damaged areas on a particular date. The Decentralized Damage Monitoring Group is working on such methodologies, with the aim of publicly disseminating damage maps that show not only where damage has occurred, but when.

    Finally, the assessment of population exposure is not a measure of actual or potential civilian casualties. These population estimates predate the most recent conflict in Gaza, and many civilians have fled. The affected population counts represent a ballpark estimate of the number of people who previously lived in areas that are now likely damaged or destroyed.
    Accessing the Tool

    The Gaza Damage Proxy Map uses previously established and tested methodology to provide estimates of damage to buildings. The data is updated approximately one to two times per week as new satellite imagery is gathered by the Sentinel-1 satellite. It therefore represents cumulative damage since October 10, not real-time damage to buildings.

    Although the information provided by the tool is an estimate, it is useful for researchers to quickly gain an overview of damaged areas in the Gaza Strip.

    You can access the Gaza Damage Proxy Map here.

    A similar tool using the same methodology to assess damage in Ukraine following Russia’s full-scale invasion and in Turkey following the February 6 Turkey-Syria earthquake, can be accessed here: https://ee-ollielballinger.projects.earthengine.app/view/gazadamage

    https://www.bellingcat.com/resources/2023/11/15/a-new-tool-allows-researchers-to-track-damage-in-gaza

    #imagerie #architecture_forensique #destruction #cartogrphie #visualisation #guerre #images_satellites #images_satellitaires #Synthetic_Aperture_Radar (#SAR) #UNOSAT #géolocalisation #photographie #dégâts #bombardements

    ping @visionscarto

  • Confirming a Strike on #Jabalia Refugee Camp as Israeli Forces Approach Gaza City

    A strike on Jabalia Refugee Camp north of #Gaza_City killed dozens on Tuesday, as the #Israel_Defense_Forces (#IDF) continued advancing into the Gaza Strip. Video and satellite analysis by Bellingcat has confirmed a strike on the Jabalia Refugee Camp, and identified several points where IDF forces have gathered on the outskirts of Gaza’s largest city.
    Jabalia Strike Highlights Concerns of Civilian Harm

    Reports began to appear online about 2:30 pm local time that an airstrike had hit the Jabalia Refugee Camp in the northern Gaza Strip.

    Videos and images have also appeared in various Telegram channels showing widespread destruction as well as injured and dead civilians at a location that Bellingcat was able to geolocate to the following coordinates in Jabalia, here: 31.53271, 34.49815.

    Three distinct buildings in the background of a photograph taken by Palestinian photojournalist Anas al-Sharif match up with satellite imagery taken on October 30.

    A Reuters live stream filming towards Jabalia and Gaza City appears to have captured a large explosion at approximately 2:24pm local time, consistent with the earliest reports of the strike on Jabalia.

    By using a technique called intersection, where known points in a view are aligned, we can identify that this explosion matches exactly with the location of the impact at Jabalia.

    At least 40 people were reportedly killed in the strike.

    The IDF confirmed an airstrike was carried out on Jabalia, stating, “The strike damaged Hamas’s command and control in the area, as well as its ability to directly military activity against IDF soldiers operating throughout the Gaza Strip.”

    Asked about civilian casualties on CNN, International IDF spokesman Lt Col Richard Hecht reiterated calls for civilians to “move south” and said the IDF is “doing everything we can to minimise” civilian casualties.

    The UN has urged Israel to reconsider its evacuation order with both humanitarian and medical organisations working in Gaza outlining that it is not possible for all civilians in northern Gaza to evacuate south, as Israel has repeatedly ordered them to do.

    The Jabalia Refugee Camp has been hit by multiple airstrikes in the past month, resulting in scores of casualties. An October 9 airstrike killed 60, an October 19 airstrike killed 18, and an October 22 airstrike killed 30.

    ”More than two million people, with nowhere safe to go, are being denied the essentials for life — food, water, shelter and medical care — while being subjected to relentless bombardment,” said UN Secretary-General António Guterres on October 29, two days prior to the latest strike. “I urge all those with responsibility to step back from the brink.”

    In Gaza City, civilians have also been struggling to access food and basic necessities. A video posted on TikTok on Sunday, October 29 showed a long queue at a bakery in Gaza. Bellingcat confirmed the location of the bakery as the New Sharq Bakery in the Jabalia refugee camp (31.5356, 34.5038).
    Attack on a Vehicle on Salah al-Din Road

    Separately, a video posted Monday morning on Instagram by Youssef Al Saifi, a Palestinian journalist, appears to show an IDF tank firing at a station wagon on Salah al-Din road. Salah al-Din had previously been identified by the IDF as a safe evacuation route for civilians within Gaza City.

    The video was geolocated by Benjamin den Braber, a Senior Investigator at the Centre for Information Resilience, to these coordinates: (31.470545, 34.432676) and independently verified by Bellingcat. The vehicle is travelling north on Salah al-Din road before encountering an IDF tank and an IDF armoured bulldozer. As the vehicle attempts a three-point turn, the tank fires at it.

    The armoured bulldozer in the video appears to be building a roadblock across Salah al-Din road. Bellingcat contacted the IDF Press Office, but they did not respond to a request for comment prior to publication. An IDF spokesperson was previously asked specifically about the tanks at a briefing and declined to give more information.

    Satellite Imagery Reveals Beginnings of a Ground Invasion

    The vehicle attack and camp strike follow an increasing presence of IDF ground troops in the Gaza Strip, which first entered the territory on October 27, according to Israeli Prime Minister Benjamin Netanyahu. Since then, satellite imagery shows the IDF have entered from at least three places: two along the territory’s northern border, and one to the southeast of Gaza City.

    Satellite imagery taken on October 30 reveals more than 50 armoured military vehicles and extensive demolition in the Al-Karama area, located approximately three to five kilometres southwest of the Gaza border.

    Israel’s ground movements have come more slowly than expected. Military specialists told Reuters on Monday that the IDF is possibly proceeding this way to draw Hamas fighters out of tunnels and densely populated areas, while also allowing for more time to negotiate for the release of hostages taken by militants during the October 7 attacks. Other reports have noted some of Israel’s allies, including the US, have advised the country to delay a full invasion.
    Approaching Gaza from the North and South

    Starting on Sunday, October 29, images began to appear on social media showing IDF vehicles and troops in northern Gaza.

    A video showed IDF soldiers raising an Israeli flag over a building geolocated inside Gaza approximately three kilometres south of the border. The geolocation was shared on X by the Geoconfirmed account, and independently confirmed by Bellingcat.

    As Israeli soldiers and vehicles have entered Gaza, some of their activities are visible on satellite imagery.

    One neighbourhood that appears to have been heavily bombed, prior to the ground invasion, was full of IDF vehicles as of October 30.

    Low-resolution satellite imagery reveals at least three major entry points for Israeli ground troops: one along Gaza’s northern border near the Mediterranean Sea, one near the Erez border crossing north of Beit Hanoun, and one southeast of Gaza City.

    Along Gaza’s northern border, imagery from October 26 showed vehicle tracks approximately 1km from the Mediterranean Sea. These tracks were joined on October 28 by a second set of tracks, closer to the sea, stretching 3km south. Satellite imagery on October 30 showed a third set of tracks, 7km to the east near the Erez border crossing towards Beit Hanoun.

    Additional tracks can be seen south-southeast of Gaza City and north of Wadi Gaza in October 28 imagery.

    The latest footage and satellite imagery shows the situation in Gaza continues to deteriorate for civilians, particularly for those located in the northern part of the territory, which remains the focus of Israeli strikes and now the ground invasion.

    Bellingcat will continue to monitor the latest war in Israel-Palestine with the aim of documenting civilian harm.

    https://www.bellingcat.com/news/2023/10/31/confirming-a-strike-on-jabalia-refugee-camp-as-israeli-forces-approach-g
    #Gaza #camp_de_réfugiés #Palestine #Israël #images_satellites #images_satellitaires #destruction #architecture_forensique #armée_israélienne #bombardements #visualisation #cartographie #Al-Karama

  • La #destruction de #Gaza vue du ciel

    La CNN a publié une série d’images satellites (https://edition.cnn.com/2023/10/25/middleeast/satellite-images-gaza-destruction/index.html) avant et après les bombardements sur Gaza. Les images post-destructions, très choquantes, montrent l’#anéantissement presque complet de nombreux quartiers d’habitations de Gaza. Des milliers de tonnes d’explosifs se sont abattus sur des immeubles et des lotissements, détruisant tout et tuant des habitants par milliers. Et les #photos_satellites datent déjà du 21 octobre. Depuis, #Israël a encore intensifié ses frappes. À cette date, 11.000 #bâtiments à Gaza avaient déjà été détruits. Selon l’ONU, environ 45% des habitations de la bande de Gaza ont été endommagées depuis le 7 octobre !

    Cela n’a rien évidemment à voir avec une prétendue « opération anti-terroriste » comme le répètent tous les médias occidentaux pour manipuler l’opinion. Et les frappes n’ont rien de ciblées, elles ne cherchent même pas à l’être. C’est une opération d’#élimination d’une #population_civile, de ses #infrastructures et de ses lieux de vie, par un régime fasciste. Certains dirigeants d’extrême droite israéliens l’assument ouvertement, il s’agit de #raser_Gaza.

    Un tel niveau de #destruction_urbaine comporte aussi d’importants risques de #contaminations, de #pollutions, de nouvelles explosions. Les millions de tonnes de #décombres comportent des matériaux dangereux pour la santé, des restes de munitions défectueuses… Et la population de Gaza n’a rien pour y faire face.

    Regardez bien ces photos. Voilà à quoi servent les armes que nous vendons à Israël. Voilà à quoi le gouvernement français apporte son « soutien inconditionnel ». Voilà ce qui est fait au nom de la France, de l’Europe, des USA.


    https://contre-attaque.net/2023/10/27/la-destruction-de-gaza-vue-du-ciel
    #bombardements #images #visualisation #images_satellites #images_satellitaires #imagerie #Palestine

    voir aussi :
    https://seenthis.net/messages/1023504

  • #Pre-frontier_information_picture

    Je découvre dans un billet de blog que j’ai lu ce matin, cette info :

    From the information gathered, Frontex produces, in addition to various dossiers, an annual situation report, which the agency calls an “Pre-frontier information picture.”

    https://digit.site36.net/2023/08/27/what-is-frontex-doing-in-senegal-secret-services-also-participate-in-t
    https://seenthis.net/messages/997841#message1014789

    ... et du coup, ce terme de « pre-frontier information picture ».

    ça me rappelle, évidemment, la carte de @reka de la #triple_frontière européenne (où une « pré-frontière » est dessinée au milieu du désert du Sahara) :


    https://visionscarto.net/mourir-aux-portes-de-l-europe

    Je découvre ainsi, en faisant un peu de recherches, qu’il y a un #projet_de_recherche financé par #Horizon_2020 dédié à cette #pré-frontière, #NESTOR :

    aN Enhanced pre-frontier intelligence picture to Safeguard The EurOpean boRders

    Un système intégré de #surveillance des #frontières de l’UE

    Les frontières de l’Europe sont soumises à une pression considérable en raison des flux migratoires, des conflits armés dans les territoires avoisinants, du trafic de biens et de personnes, et de la criminalité transnationale. Toutefois, certains obstacles géographiques, tels que les forêts denses, les hautes montagnes, les terrains accidentés ou les zones maritimes et fluviales entravent la surveillance des itinéraires empruntés par les réseaux criminels. Le projet NESTOR, financé par l’UE, fera la démonstration d’un #système_global_de_surveillance des frontières de nouvelle génération, entièrement fonctionnel et proposant des #informations sur la situation #en_amont des frontières et au-delà des frontières maritimes et terrestres. Ce système repose sur le concept de la gestion européenne intégrée des frontières et recourt à des #technologies d’analyse d’#images_optiques et du spectre de fréquences radio alimentées par un réseau de #capteurs_interopérables.

    Objectif

    For the past few years, Europe has experienced some major changes at its surrounding territories and in adjacent countries which provoked serious issues at different levels. The European Community faces a number of challenges both at a political and at a tactical level. Irregular migration flows exerting significant pressure to the relevant authorities and agencies that operate at border territories. Armed conflicts, climate pressure and unpredictable factors occurring at the EU external borders, have increased the number of the reported transnational crimes. Smuggling activity is a major concern for Eastern EU Borders particularly, as monitoring the routes used by smugglers is being hindered by mountainous, densely forested areas and rough lands aside with sea or river areas. Due to the severity and the abrupt emergence of events, the relevant authorities operate for a long-time interval, under harsh conditions, 24 hours a day. NESTOR aims to demonstrate a fully functional next generation holistic border surveillance system providing pre-frontier situational awareness beyond maritime and land border areas following the concept of the European Integrated Border Management. NESTOR long-range and wide area surveillance capabilities for detection, recognition classification and tracking of moving targets (e.g. persons, vessels, vehicles, drones etc.) is based on optical, thermal imaging and Radio Frequency (RF) spectrum analysis technologies fed by an interoperable sensors network including stationary installations and mobile manned or unmanned vehicles (aerial, ground, water, underwater) capable of functioning both as standalone, tethered and in swarms. NESTOR BC3i system will fuse in real-time border surveillance data combined with web and social media information, creating and sharing a pre-frontier intelligent picture to local, regional and national command centers in AR environment being interoperable with CISE and EUROSUR.

    https://cordis.europa.eu/project/id/101021851/fr

    Projet de 6 mio. d’euro et coordonné par la #police_grecque (#Grèce) :

    Les participants (#complexe_militaro-industriel) au projet :


    #business

    #données #technologie #interopérabilité #frontières #migrations #asile #réfugiés #surveillance_des_frontières #_Integrated_Border_Management #fréquence_radio #NESTOR_BC3i_system #CISE #EUROSUR

  • #Chine : le drame ouïghour

    La politique que mène la Chine au Xinjiang à l’égard de la population ouïghoure peut être considérée comme un #génocide : plus d’un million de personnes internées arbitrairement, travail forcé, tortures, stérilisations forcées, « rééducation » culturelle des enfants comme des adultes…
    Quel est le veritable objectif du parti communiste chinois ?

     
    http://www.film-documentaire.fr/4DACTION/w_fiche_film/64324

    #Ouïghours #Xinjiang #camps_d'internement #torture #stérilisation_forcée #camps_de_concentration #persécution #crimes_contre_l'humanité #silence #matières_premières #assimilation #islam #islamophobie #internement #gaz #coton #charbon #route_de_la_soie #pétrole #Xi_Jinping #séparatisme #extrémisme #terrorisme #Kunming #peur #état_policier #répression #rééducation #Radio_Free_Asia #disparition #emprisonnement_de_masse #images_satellites #droits_humains #zone_de_non-droit #propagande #torture_psychique #lavage_de_cerveau #faim #Xinjiang_papers #surveillance #surveillance_de_masse #biométrie #vidéo-surveillance #politique_de_prévention #surveillance_d'Etat #identité #nationalisme #minorités #destruction #génocide_culturel #Ilham_Tohti #manuels_d'école #langue #patriotisme #contrôle_démographique #contrôle_de_la_natalité #politique_de_l'enfant_unique #travail_forcé #multinationales #déplacements_forcés #économie #colonisation #Turkestan_oriental #autonomie #Mao_Zedong #révolution_culturelle #assimilation_forcée #Chen_Quanguo #cour_pénale_internationale (#CPI) #sanctions

    #film #film_documentaire #documentaire

  • Participer à cartographier le monde pour mieux prévenir les crises humanitaires

    Cartographier les zones de la planète les plus vulnérables pour faciliter l’intervention humanitaire en cas de catastrophe. C’est la mission que s’est fixée depuis des années le projet Missing Maps. Le tout grâce à la carte participative OpenStreetMap et à une armée de contributeurs bénévoles.

    « Au printemps dernier, les organisations humanitaires ont commencé à sonner l’alarme », rapporte Jana Bauerová, du bureau tchèque de Médecins sans frontières (MSF). L’une des pires sécheresses de ces dix dernières années, conjuguée à la pandémie de Covid-19 et aux divers confinements avaient plongé le sud de Madagascar dans une grave crise alimentaire. « Des collègues ont réalisé une mission d’exploration en mars », poursuit la jeune femme. Dans les districts les plus touchés, près de 28% des enfants de moins de 5 ans souffraient de malnutrition aigüe, dont une partie de malnutrition aigüe grave. Autrement dit, sans soins immédiats, leur chance de survie est faible.

    Problème : la zone est enclavée, beaucoup de routes ne sont pas carrossables, et surtout les cartes disponibles sont obsolètes. « Il y avait un fort besoin d’actualisation sur les populations, détaille Jana Bauerová, chargée de la communication et de la participation des communautés pour le projet Missing Maps au sein de MSF. On a donc mis en place une campagne pour cartographier les districts d’Amboasary et d’Ambovombe, dans la région d’Anôsy, les communes les plus atteintes, où nos collègues sur le terrain prévoyaient des projets de cliniques mobiles, d’accès à l’eau potable, également dégradé par la sécheresse, des actions de distribution alimentaire et même d’ustensiles de cuisine, certaines familles, au bord de la famille, ayant tout vendu. »
    Mieux visualiser les actions à mener

    « Nous avons pu cartographier 236 000 bâtiments et 7 239 zones résidentielles ainsi que 350 km de voies, précise Jana Bauerová. Cela a permis d’aider les collègues sur place à mieux visualiser la situation en prenant en compte les dernières données pour planifier les actions à mettre en place. » Mais au-delà de ces chiffres, les nouvelles données récoltées ont aussi permis à l’ONG de confirmer la pertinence de l’option de cliniques mobiles pour ces zones difficiles d’accès, et bien sûr d’organiser au mieux leur répartition.

    « Remettre les communautés les plus vulnérables sur la carte ». C’est le slogan du projet Missing Maps. Fondé en 2014 par les Croix Rouge américaine et britannique, l’Humanitarian OpenStreetMap Team (HOT) et Médecins sans frontières UK, le projet part du principe que « la plupart des endroits où se produisent des catastrophes sont absents des cartes libres et accessibles, et les premiers secours manquent d’informations pour prendre les bonnes décisions ». L’idée est donc de cartographier préventivement ces zones afin d’améliorer la réponse des ONG en cas de crises.

    Comment ? Grâce à la cartographie numérique participative. « Le principe consiste à mobiliser des contributeurs autour d’un projet précis », explique Martin Noblecourt, responsable du projet Missing Maps au sein de CartONG. Basée à Chambéry, en France, cette ONG a pour vocation de mettre la donnée géographique au service de projets d’intérêt général, à travers notamment un appui technique à des organisations qui ont des besoins en cartographie.
    « Un milliard de personnes vivent dans des zones non ou insuffisamment cartographiées »

    GPS, Google Maps… Les cartes sont entrées dans notre quotidien. Aujourd’hui, plus besoin de s’arracher les cheveux pour les plier, elles tiennent dans la poche et sont disponibles à tout moment. Mieux, elles sont sans cesse actualisées. Pourtant, qu’ils habitent dans des bidonvilles ou des régions reculées, « on estime qu’un milliard de personnes vivent dans des zones non ou insuffisamment cartographiées, ce qui a un gros impact sur les ressources auxquelles elles peuvent accéder, en cas d’urgence particulièrement, si on ne sait même pas que des gens vivent là », souligne Gihan Hassanein, chargée de la communication pour l’Humanitarian OpenStreetMap Team (HOT), l’ONG adossée à OpenStreetMap, ce projet qui a pour but de créer en ligne une carte libre du monde entier.

    Exister sur une carte n’a rien d’anodin, rappelle Christophe Chabert, cartographe indépendant et auteur du site Mind The Map. Il rappelle par exemple que le gouvernement de Jair Bolsonaro au Brésil veut demander aux peuples indigènes d’Amazonie de prouver, par des documents, qu’ils vivaient déjà sur ses terres lors de la signature de la Constitution de 1988. « S’il existait une cartographie qui recense les villages, on pourrait avoir un élément de preuve qui permettrait à ces populations d’accéder à la propriété sur ces terres », avance-t-il.

    Point essentiel, souligne Martin Noblecourt : les cartes sont réalisées sur OpenStreetMap, « le Wikipédia des cartes », « une carte du monde participative, collaborative et sous licence libre, donc qui peut être utilisée par tout le monde ». D’autres ONG pourront ainsi réutilisées librement ces données.

    Tout a commencé en 2010, explique la porte-parole de HOT, lors du tremblement de terre en Haïti. « Les dégâts étaient énormes à Port-au-Prince et il n’y avait pas de cartes fiables et actualisés de la ville. Les premiers secours ne savaient même pas où chercher les gens. » Une poignée de gens qui utilisaient déjà OpenStreetMap se sont alors réunis pour cartographier la zone à distance à l’aide des images satellites. Depuis, le petit groupe est devenu une ONG, qui n’a cessé de grandir, et des communautés de contributeurs locaux ont éclos autour du monde.

    Mais comment cartographier rapidement une région précise ? La première étape a lieu en ligne, explique le responsable projet Missing Maps de CartONG : des contributeurs tracent sur des images satellites les principaux éléments. Un outil permet de diviser la zone en petits carrés où ils identifient les quadrilatères ou polygones des bâtiments, les différentes voies, les cours d’eau. La deuxième étape se passe sur le terrain. « Cette partie à distance doit ensuite être complétée sur place, soit par des membres des ONG, soit par des contributeurs bénévoles locaux, qui se baladent avec un smartphone afin de récolter des informations sur des points précis tels que les centre de santé, les écoles, les installations sanitaires, etc. Ils peuvent aussi rajouter des informations plus qualitatives sur l’état de certaines infrastructures par exemple. » Un système de validations multiples permet de s’assurer de la fiabilité des données.
    « Mapathons »

    La démocratisation des images satellitaires, qui ne sont plus réservées à un usage militaire, et la multiplication des données disponibles ont mis la cartographie à la portée du tous. Pour participer, pas besoin d’être informaticien ou expert en cartographie, il suffit d’un ordinateur, d’une souris et d’une connexion wifi, expliquent les organisations. Et à la clé, la satisfaction d’avoir contribué, à son échelle et derrière son écran, à un projet à visée humanitaire.

    Pour encore plus d’efficacité, des « mapathons », où des anonymes viennent cartographier pendant un temps précis une zone précise, sont régulièrement organisés. En 2020, à la demande du Haut-Commissariat pour les réfugiés (HCR), CartONG a par exemple organisé plusieurs événements de ce type pour cartographier des camps de réfugiés au Soudan du Sud, au Soudan, en Birmanie et en Éthiopie, « des zones qui bougent vite et ne sont généralement pas sur les cartes officielles », commente Martin Noblecourt. « Ce qu’on voit essentiellement sur les images satellites, c’est le réseau routier, les tentes et quelques infrastructures pas forcément identifiées. Après, le personnel du HCR complète. » Selon le site de CartONG, quelque 700 contributeurs ont ainsi passé près de 700 heures à cartographier 180 000 bâtiments et 3 800 km de route. « Un moyen de calculer par exemple combien de tentes sont à moins de 50 ou 100 mètres d’un point d’eau et combien de personnes en dépendent. Et donc d’aider à la prise de décision : savoir où il faut réimplanter des points d’eau. »

    Évaluer les besoins, les représenter visuellement sur une carte, adapter les actions et mesurer leur impact… Les usages sont très variés. La pandémie de Covid-19 a par exemple généré des besoins en cartographie, notamment pour organiser les campagnes de vaccination. Mais il peut aussi s’agir de mieux préparer les populations aux catastrophes naturelles. « Nous venons de faire un projet au Tadjikistan qui a consisté à accompagner une ONG locale, The Little Earth, pour identifier des villages reculés et y collecter des données, notamment sur les réseaux hydrographiques et les risques que cela génère en termes d’inondations, les points de rassemblements, les installations sanitaires, etc. Et eux après, ont organisé des animations de sensibilisation au risque avec les habitants. »
    Renforcer les communautés contributeurs locaux

    Des projets collaboratifs qui permettent de créer une émulation locale. « J’étais justement en train de nettoyer les données », explique Jackson Mumbere Kombi au téléphone. En gros, un travail de tri. Il fait partie des centaines de membres de la communauté de contributeurs d’OpenStreetMap RDC (OSM RDC). Lorsqu’il a commencé à cartographier Beni, au Nord-Kivu, dans l’est de la République démocratique du Congo, en 2018, explique-t-il, « la carte était quasi-vierge ». Avec d’autres contributeurs, ils y ont progressivement ajouté des données basiques – bâtiments, routes, lieux publics (églises, marchés, etc.) puis des données plus précises comme la localisation des centres de santé par exemple ou encore la délimitation des parcelles agricoles. Au fil du temps, il s’est formé aux outils. Puis c’est lui qui a formé une petite équipe de jeunes de Beni, toujours avec OSM RDC, qui continue à travailler sur la carte et à l’actualiser.

    Il y a une « fierté » pour les habitants à être cartographiés, « à pouvoir dire : ici, c’est ma maison », affirme-t-il. « Et cela leur permet de mieux maîtriser leur milieu. « L’idée, c’est que si quelqu’un a besoin d’une information, il puisse la trouver facilement, justifie-t-il. Grâce à cette cartographie précise, pendant l’épidémie d’Ebola, on a pu mieux localiser certains contacts à risque. Donc mieux orienter les personnels de santé. »

    « Soutenir les communauté OpenStreetMap dans le monde. » Aujourd’hui, c’est ce à quoi travaille l’équipe humanitaire OSM (HOT), qui revendique 268 000 contributeurs, explique sa porte-parole. « S’assurer qu’ils ont l’équipement dont ils ont besoin, qu’ils ont les compétences dont ils ont besoin, s’assurer que les données sont de bonnes qualités », précise Gihane Hassanein. Les communautés OSM peuvent aussi postuler à des bourses pour des projets précis.

    L’un des derniers chantiers pour Jackson Mumbere Kombi à Beni reste d’ajouter les noms de rues manquants. Dans cette ville en proie à des massacres répétés depuis plusieurs années, l’enjeu c’est aussi la sécurité. Après, pointe le contributeur, il faudra s’occuper de rendre « visible » le reste de la RDC.

    https://www.rfi.fr/fr/technologies/20211128-participer-%C3%A0-cartographier-le-monde-pour-mieux-pr%C3%A9venir-les-c

    #humanitaire #cartographie #crises #cartographie_collaborative #cartographie_participative #catastrophes #OpenStreetMap #OSM #Missing_Maps #Humanitarian_OpenStreetMap_Team (#HOT) #MSF #cartographie_numérique #mapathon #images_satellitaires #mages_satellites #géographie_du_plein #géographie_du_vide

    #ressources_pédagogiques

  • Migration de transit : #Belgique et #France appellent #Frontex à l’aide

    L’agence aux frontières extérieures pourrait fournir une surveillance aérienne pour identifier les embarcations tentant de traverser la #Manche depuis les côtes françaises.

    Et pourquoi ne pas aider le nord ? Dans le cadre des « #consultations_de_Val_Duchesse » – rencontre entre gouvernements français et belge sur les thématiques sécuritaires –, Sammy Mahdi, le secrétaire d’Etat à l’Asile et la Migration, a appuyé la #demande française d’un #renfort de l’agence des frontières extérieures, Frontex, pour surveiller la #côte_d’Opale. En cause : le nombre grandissant de traversées de migrants tentant de rejoindre l’Angleterre par la mer. En à peine deux jours, ce week-end, près de 250 personnes ont ainsi été secourues par les autorités alors qu’elles étaient en difficulté en mer. « Depuis le Brexit, la lutte contre la transmigration n’est pas devenue plus facile », a souligné le secrétaire d’Etat dans un communiqué. « Frontex apporte son aide dans le sud et l’est de l’Europe, mais devrait également le faire dans le nord. »

    Phénomène longtemps marginal, les traversées irrégulières de la Manche par bateau ont commencé à augmenter à partir de fin 2019 et n’ont pas cessé depuis. Un transfert s’expliquant probablement par la sévérité des contrôles des camions, par l’imminence du Brexit – dont le bruit courait qu’il aurait un impact sur la possibilité de franchir la frontière avec des contrôles douaniers systématiques – et peut-être par l’effet dissuasif du drame de l’Essex, lorsque 39 personnes avaient été retrouvées mortes dans un camion frigorifique. Mais aussi… par son taux de réussite. Depuis le début de l’année, la préfecture maritime Manche-mer du Nord a enregistré 1.231 tentatives de traversées impliquant plus de 31.500 personnes (certaines personnes ayant pu être impliquées dans plusieurs traversées). Seules un quart ont été interceptées et ramenées vers les côtes françaises. Et comme le Royaume-Uni a refusé de négocier un volet « réadmission » dans le cadre de l’accord du Brexit (pour remplacer le règlement Dublin), il doit gérer les personnes migrantes une fois débarquées.

    Pour les autorités belges, mais surtout françaises, le défi tient à l’immensité de la zone à surveiller. Alors que les départs avaient jusqu’à récemment lieu depuis les alentours de Calais, le point le plus proche de l’Angleterre, ils se sont dispersés vers le sud à mesure de la hausse des contrôles, allant jusqu’au Touquet, à 70 km de là. Ils sont en revanche toujours rarissimes côté belge. Les petites embarcations restent la norme – Decathlon a annoncé il y a quelques jours suspendre la vente de ses kayaks dans les magasins de Calais et Grande-Synthe, constatant un « détournement de leur usage sportif » –, signe de traversées autonomes. « Mais depuis 2019, avec la montée en puissance de réseaux criminels, voire mafieux, nous voyons des embarcations de plus en plus grandes et de plus en plus chargées, engendrant un effet de saturation ponctuelle. Les embarcations plus robustes, type voiliers ou chalutiers, restent plus anecdotiques », indique la préfecture maritime. Comprendre : les moyens de traversée les plus sûrs sont les plus rares. Or, la Manche est réputée être une autoroute de cargos, très dangereuse pour de petites embarcations la traversant.

    La France a déjà considérablement renforcé les moyens de surveillance et le travail de coordination pour mieux contrôler la côte, soutenue par une enveloppe de 62 millions d’euros promise par le Royaume-Uni. Un cadre opérationnel doit encore être déterminé pour définir l’intervention de Frontex : combien de temps, quels moyens humains, matériels… L’agence indique que la demande concerne du « soutien de surveillance aérienne ».

    « Ce serait la première fois que Frontex s’emploie à stopper les flux sortants au lieu de protéger les frontières extérieures contre les menaces extérieures », souligne le cabinet du secrétaire d’Etat Sammy Mahdi. « Mais si vous regardez les chiffres des départs en 2021, c’est une façon valable de penser. Si ce modèle continue à porter ses fruits avec les arrivées au Royaume-Uni, la transmigration sera difficile à arrêter. »

    https://www.lesoir.be/407906/article/2021-11-22/migration-de-transit-belgique-et-france-appellent-frontex-laide
    #asile #migrations #réfugiés #frontières #aide

    • Frontex deploys Danish surveillance aircraft over northern France

      Frontex has deployed a plane to support French and Belgian authorities trying to spot illegal boat crossing activity, a week after 27 migrants drowned when their dinghy deflated in the Channel, the European Union’s joint frontier force said.

      In a statement, Frontex said the plane, provided by Denmark had landed in Lille, northern France, adding the aircraft was equipped with modern sensors and radar to support land and sea border control.

      The deployment was decided during a meeting on Sunday in Calais between French Interior Minister Gerald Darmanin and some of his European counterparts, an event to which British Interior Minister Priti Patel had been disinvited following a letter from British Prime Minister Boris Johnson letter that angered Paris. (https://www.reuters.com/world/europe/france-says-it-will-not-be-held-hostage-by-british-politics-migration-2021-)

      France and Britain are at loggerheads over post-Brexit trading rules and fishing rights and last week relations soured further after 27 people died trying to cross the Channel.

      “The evolution of the situation in the Channel is a matter of concern. Upon the request from member States, Frontex deployed a plane in France to support them with aerial surveillance in just three days,” Frontex Director Fabrice Leggeri said.

      “We are starting with one plane, but we stand ready to reinforce our support if needed.”

      The aim of the operation on the coastline is to prevent the rising number of sea crossings.

      https://www.reuters.com/world/europe/frontex-deploys-danish-surveillance-aircraft-over-northern-france-2021-12-0

      #Danemark #militarisation_des_frontières

    • Le ministre de l’Intérieur @GDarmanin a annoncé la semaine dernière la mise en service d’un avion de l’agence #Frontex pour surveiller les traversées de migrants dans la Manche.

      Repéré par notre collègue @MickaelGoavec, l’appareil a commencé à survoler la zone aujourd’hui.

      Comment s’y prendre pour pister l’appareil ?
      La photo ci-dessus ne montre pas l’immatriculation.

      En cherchant sur Twitter on tombe sur un autre tweet du ministère @Interieur_Gouv et on devine les chiffres «  ??-080 ».

      En passant cette image dans Bing et en zoomant sur l’avion, on tombe sur plusieurs photos d’un appareil ressemblant fortement à celui évoqué par @GDarmanin.

      On peut alors récolter « l’empreinte » de l’avion :

      Immat. : C-080 de la Royal Danish Air Force
      Code ICAO/HEX : 45F422

      En poursuivant les recherches, on tombe sur cette note diffusée par le ministère des Affaires étrangères danois.

      Elle indique que l’avion a été envoyé par le #Danemark pour contribuer à l’opération Triton de lutte contre l’immigration illégale en Méditerranée en 2017.

      Comme beaucoup d’avions militaires et gouvernementaux, le parcours de vol est masqué sur la plupart des sites comme @flightradar24
      ou @flightaware
      .

      Le site @RadarBox24 montre un parcours partiel mais précise bien que les informations sont « bloquées ».

      Mais certains internautes l’ont déjà repéré avant qu’il n’atterrisse à Lille.

      Et d’autres sites, notamment @ADSBexchange, n’acceptent généralement pas les demandes des particuliers ou des organisations souhaitant masquer leurs avions des sites de tracking.

      On peut donc suivre le parcours de l’appareil de surveillance en direct sur ce site :
      https://globe.adsbexchange.com/?icao=45f422

      On remarque un « motif » de surveillance et une altitude basse, un peu moins de 400m.

      Il semble aussi s’attarder sur les dunes qui entourent les villes de #Dunkerque et #GrandeSynthe, où les migrants ont installé des campements.

      https://twitter.com/RevelateursFTV/status/1466745416045764614

    • Migrants dans la Manche : Frontex a la « possibilité de déployer des personnels au sol »

      Fabrice Leggeri, directeur exécutif de Frontex, a été auditionné ce mercredi 8 décembre devant la commission des affaires étrangères du Sénat. Il est revenu sur la « nouvelle opération » de #surveillance_aérienne dans la Manche, qui a commencé début décembre, ainsi que sur les différentes crises auxquelles fait face l’agence européenne. « On va vivre pour longtemps avec une pression migratoire forte », prévient-il.

      Entre la France et le Royaume-Uni, la tension reste forte sur la question de l’immigration depuis le naufrage, au large de Calais, d’une embarcation causant la mort de 27 personnes, le 24 novembre dernier. Hier, lors de son audition à la commission des Lois de l’Assemblée nationale, le ministre de l’Intérieur Gérald Darmanin a demandé, une fois de plus, au Royaume-Uni « d’ouvrir une voie légale d’immigration » pour réduire le nombre de traversées illégales entre les deux pays. Ce mercredi, Fabrice Leggeri, le directeur exécutif de Frontex, a détaillé devant les membres de la commission des affaires étrangères du Sénat la « #nouvelle_opération » de surveillance de l’agence européenne de #garde-côtes et #gardes-frontières dans la Manche. « L’#avion de Frontex est arrivé à Lille le 1er décembre et a commencé ses patrouilles [..]. Nous fournissons depuis quelques semaines des #images_satellitaires à la France - la Belgique est intéressée, les Pays Bas aussi - pour détecter quelques jours à l’avance des #préparatifs_de_départs, des activités de #passeurs ou de #trafiquants près de la #côte », indique-t-il.

      « Nous pouvons faire davantage » si des États le souhaitent

      Pour assurer la #surveillance des dizaines de kilomètres de côtes, en France, en Belgique ou même aux Pays-Bas, Fabrice Leggeri garantit que « nous pouvons faire davantage s’il y a un souhait [des pays] d’aller plus loin ». Outre « le #rapatriement et l’#éloignement des #étrangers_en_situation_irrégulière, nous avons la possibilité de déployer des personnels de gardes-frontières au #sol qui pourraient avoir des missions de surveillance en complément et sous la direction des autorités nationales ». Sans oublier le devoir d’information de l’agence si elle observe « des situations de détresse en mer ».

      Interrogé sur la tenue de discussions avec le Royaume-Uni pour pouvoir intervenir sur leur territoire, le directeur de Frontex pointe « un paradoxe. Nous sommes présents physiquement en Albanie, en Serbie, parce qu’il y a un accord entre l’Union Européenne et ces pays-là, mais il n’y en a pas le Royaume-Uni. Pas d’accord post-Brexit pour coopérer avec eux dans la Manche ». Et Fabrice Leggeri d’insister sur sa volonté de travailler « dans un cadre juridique. On ne peut pas faire du bricolage à la carte ».

      « Avoir un cadre juridique clair »

      Sur d’autres frontières, en Biélorussie, Pologne et Lituanie, le patron de Frontex – qui parle de « #menace_hybride, d’une instrumentalisation des migrants comme moyen de pression politique ou géopolitique - rapporte aussi « une incertitude juridique qui me préoccupe au moins autant que la force physique ». Il donne l’exemple d’une loi lituanienne, adoptée à l’été 2021 en réponse à l’afflux de migrants à sa frontière : « Certains disent que cette loi n’est pas conforme à l’ordre juridique de l’Union européenne. […] Il est important pour l’agence d’avoir un cadre juridique clair. Ce n’est pas le cas actuellement ».

      Au total, entre 2 000 et 2 200 personnels de Frontex sont déployés dans l’Union Européenne. Les plus grosses opérations ont, pour le moment, lieu en Grèce (400 personnels), Italie (200), Espagne (200) et en Lituanie (une centaine). L’objectif est d’atteindre les 10 000 agents en 2027. Qui seront les bienvenus, selon Fabrice Leggeri. Car en plus de la lutte contre la criminalité et la prévention des menaces terroristes, « on va vivre pour longtemps avec une #pression_migratoire forte. La démographie l’explique, les déséquilibres économiques aussi, accentués avec la #crise_sanitaire ».

      https://www.publicsenat.fr/article/parlementaire/migrants-dans-la-manche-frontex-a-la-possibilite-de-deployer-des-personn

    • Frontex en action dans la Manche : la Grande-Bretagne, une force d’attraction pour les réfugiés

      Le pilote danois #Michael_Munkner est de retour à la base après cinq heures et demie de vol au-dessus de la Manche.

      Il est commandant de l’avion « #Côte_d'Opale » dans le cadre de l’opération européenne Frontex. Depuis le naufrage d’un radeau qui a tué 27 demandeurs d’asile le mois dernier, il surveille la zone :

      « Je ne peux pas entrer dans le détail de ce que nous avons vu exactement, mais nous avons pris quelques photos que nous pouvons vous montrer des différents camps que nous surveillons en particulier à Calais et Dunkerque. Nous surveillons les camps pour voir, ce qu’ils font, s’ils se préparent à partir, et aussi bien sûr les plages pour voir s’il y a des départs. »

      L’agence Frontex a organisé des vols au-dessus de la zone à la demande de la France. La mission est censée durer jusqu’à la fin de l’année.

      Si les agents ont admis que des discussions sur le renouvellement de leur mandat étaient en cours, certains doutent de l’efficacité des mesures prises pour dissuader les personnes désespérées d’effectuer la traversée de la Manche.

      « Je pense que les gens tenteront la traversée. S’ils sont suffisamment désespérés, ils iront, quoi qu’il arrive. J’espère simplement que nous pourrons être là pour aider à éviter les pertes de vies humaines » explique Michael Munkner, le commandant du détachement Frontex pour la Manche.

      Elyaas Ehsas est un réfugié afghan. Il est d’accord pour dire que les exilés continueront de chercher à traverser par tous les moyens pour se rendre au Royaume-Uni, malgré les obstacles.

      « S’ils avaient une chance de rester dans leur pays d’origine, ils resteraient. Imaginez comme ça... quelqu’un dans votre pays vous prend tout, que feriez-vous ? »

      Elyaas a quitté l’Afghanistan il y a 6 ans. Après avoir vu sa demande d’asile rejetée par la Suède, il avait aussi pensé à faire la traversée de la Manche :

      « Une des raisons pour lesquelles les gens traversent et prennent beaucoup de risques, c’est à cause de l’accord de Dublin, ils se disent si je vais au Royaume-Uni, il n’y a pas de règlement de Dublin au Royaume-Uni à cause du Brexit. Le Royaume-Uni a quitté l’Union européenne, et donc il n’y a pas d’empreintes digitales. Au moins, ils peuvent rester là-bas pendant un certain temps et se reconstruire une nouvelle vie. »

      Le règlement de Dublin part du principe que les réfugiés bénéficient du même niveau de protection dans tous les États membres de l’UE, et qu’ils doivent demander l’asile dans le pays d’arrivée.

      Les 27 ont reconnu les limites du dispositif et promis de créer un nouveau système de gouvernance migratoire.

      Le mois dernier, Elyaas a pu faire une nouvelle demande d’asile, cette fois-ci en France. Mais son histoire n’est pas encore terminée. Il dit que si les autorités françaises rejettent sa demande, il poursuivra son voyage quelles qu’en soient les conséquences.

      https://fr.euronews.com/2021/12/17/frontex-en-action-dans-la-manche-la-grande-bretagne-une-force-d-attract

  • #Eyal_Weizman : « Il n’y a pas de #science sans #activisme »

    Depuis une dizaine d’années, un ensemble de chercheurs, architectes, juristes, journalistes et artistes développent ce qu’ils appellent « l’architecture forensique ». Pour mener leurs enquêtes, ils mettent en œuvre une technologie collaborative de la vérité, plus horizontale, ouverte et surtout qui constitue la vérité en « bien commun ». Eyal Weizman en est le théoricien, son manifeste La Vérité en ruines a paru en français en mars dernier.

    https://aoc.media/entretien/2021/08/06/eyal-weizman-il-ny-a-pas-de-science-sans-activisme-2

    #recherche #architecture_forensique #forensic_architecture #vérité #preuve #preuves #régime_de_preuves #spatialisation #urbanisme #politique #mensonges #domination #entretien #interview #espace #architecture #preuves_architecturales #cartographie #justice #Palestine #Israël #Cisjordanie #Gaza #images_satellites #contre-cartographie #colonialisme #Etat #contrôle #pouvoir #contre-forensique #contre-expertise #signaux_faibles #co-enquête #positionnement_politique #tribunal #bien_commun #Adama_Traoré #Zineb_Redouane #police #violences_policières #Rodney_King #Mark_Duggan #temps #Mark_Duggan #Yacoub_Mousa_Abu_Al-Qia’an #Harith_Augustus #fraction_de_seconde #racisme #objectivité #impartialité #faits #traumatisme #mémoire #architecture_de_la_mémoire #Saidnaya #tour_Grenfell #traumatisme #seuil_de_détectabilité #détectabilité #dissimulation #créativité #art #art_et_politique

    • La vérité en ruines. Manifeste pour une architecture forensique

      Comment, dans un paysage politique en ruines, reconstituer la vérité des faits ? La réponse d’Eyal Weizman tient en une formule-programme : « l’architecture forensique ». Approche novatrice au carrefour de plusieurs disciplines, cette sorte d’architecture se soucie moins de construire des bâtiments que d’analyser des traces que porte le bâti afin de rétablir des vérités menacées. Impacts de balles, trous de missiles, ombres projetées sur les murs de corps annihilés par le souffle d’une explosion : l’architecture forensique consiste à faire parler ces indices.
      Si elle mobilise à cette fin des techniques en partie héritées de la médecine légale et de la police scientifique, c’est en les retournant contre la violence d’État, ses dénis et ses « fake news ». Il s’agit donc d’une « contre-forensique » qui tente de se réapproprier les moyens de la preuve dans un contexte d’inégalité structurelle d’accès aux moyens de la manifestation de la vérité.
      Au fil des pages, cet ouvrage illustré offre un panorama saisissant des champs d’application de cette démarche, depuis le cas des frappes de drone au Pakistan, en Afghanistan et à Gaza, jusqu’à celui de la prison secrète de Saidnaya en Syrie, en passant par le camp de Staro Sajmište, dans la région de Belgrade.

      https://www.editionsladecouverte.fr/la_verite_en_ruines-9782355221446
      #livre

  • États-Unis - #Détroit : une « #Shrinking_city », entre #crise_automobile, #ségrégation et #évitement

    Ville de 670 000 habitants dans une grande région métropolitaine de 6,3 millions d’habitants, Détroit fut le berceau de l’industrie automobile. Cette Motor City des Grands Lacs dominée par les Big Three - Ford, General Motors et Chrysler - traverse depuis les années 1970 une crise systémique, à la fois économique, industrielle, sociale et urbaine. Les processus de hiérarchisation, de ségrégation fonctionnelle et raciale et d’évitement ont débouché sur un effondrement de sa population, de son tissu productif et de son cadre urbain, la transformant en une icône des « Shrinking Cities ». Face à l’abandon de dizaines de milliers de pavillons sur 65 % de son territoire communal, les destructions massives ont créé un espace-mosaïque singulier alors que l’initiative privée réinvestit quelques sites privilégiés (CBD, Midtown, rives fluviales). Pour autant, la crise de la ville-centre alimente des dynamiques centrifuges bénéficiant largement à son espace régional, de plus en plus multipolaire. Replacer Détroit par emboitements d’échelles dans sa grande région permet alors d’éclairer les dynamiques urbaines, dont l’urban sprawl, d’une large partie des territoires métropolitains des États-Unis.


    https://geoimage.cnes.fr/fr/geoimage/etats-unis-detroit-une-shrinking-city-entre-crise-automobile-segregati
    #USA #Etats-Unis #images_satellitaires #visualisation

  • Au #Tigré_éthiopien, la #guerre « sans pitié » du prix Nobel de la paix

    Le premier ministre éthiopien #Abyi_Ahmed oppose une fin de non-recevoir aux offres de médiation de ses pairs africains, alors que les combats entre l’armée fédérale et les forces de la province du Tigré ne cessent de prendre de l’ampleur.

    Le gouvernement d’Addis Abéba continue de parler d’une simple opération de police contre une province récalcitrante ; mais c’est une véritable guerre, avec blindés, aviation, et des dizaines de milliers de combattants, qui oppose l’armée fédérale éthiopienne aux forces de la province du Tigré, dans le nord du pays.

    Trois semaines de combats ont déjà provoqué l’afflux de 30 000 #réfugiés au #Soudan voisin, et ce nombre pourrait rapidement grimper après l’ultimatum lancé hier soir par le gouvernement aux rebelles : 72 heures pour se rendre. L’#armée demande aussi à la population de la capitale tigréenne, #Makelle, de se « libérer » des dirigeants du #Front_de_libération_du_peuple_du_Tigré, au pouvoir dans la province ; en cas contraire, a-t-elle prévenu, « il n’y aura aucune pitié ».

    Cette escalade rapide et, en effet, sans pitié, s’accompagne d’une position inflexible du premier ministre éthiopien, Abyi Ahmed, vis-à-vis de toute médiation, y compris celle de ses pairs africains. Addis Abéba a opposé une fin de non-recevoir aux tentatives de médiation, celle des voisins de l’Éthiopie, ou celle du Président en exercice de l’Union africaine, le sud-africain Cyril Ramaphosa. Ils seront poliment reçus à Addis Abéba, mais pas question de les laisser aller au Tigré ou de rencontrer les leaders du #TPLF, le front tigréen considéré comme des « bandits ».

    Pourquoi cette position inflexible ? La réponse se trouve à la fois dans l’histoire particulièrement violente de l’Éthiopie depuis des décennies, et dans la personnalité ambivalente d’Abyi Ahmed, le chef du gouvernement et, ne l’oublions pas, prix Nobel de la paix l’an dernier.

    L’histoire nous donne des clés. Le Tigré ne représente que 6% des 100 millions d’habitants de l’Éthiopie, mais il a joué un rôle historique déterminant. C’est du Tigré qu’est partie la résistance à la sanglante dictature de Mengistu Haile Mariam, qui avait renversé l’empire d’Haile Selassie en 1974. Victorieux en 1991, le TPLF a été au pouvoir pendant 17 ans, avec à sa tête un homme fort, Meles Zenawi, réformateur d’une main de fer, qui introduira notamment le fédéralisme en Éthiopie. Sa mort subite en 2012 a marqué le début des problèmes pour les Tigréens, marginalisés après l’élection d’Abyi Ahmed en 2018, et qui l’ont très mal vécu.

    La personnalité d’Abyi Ahmed est aussi au cœur de la crise actuelle. Encensé pour ses mesures libérales, le premier ministre éthiopien est également un ancien militaire inflexible, déterminé à s’opposer aux forces centrifuges qui menacent l’unité de l’ex-empire.

    Ce contexte laisse envisager un #conflit prolongé, car le pouvoir fédéral ne renoncera pas à son offensive jusqu’à ce qu’il ait, au minimum, repris Mekelle, la capitale du Tigré. Or cette ville est à 2500 mètres d’altitude, dans une région montagneuse où les avancées d’une armée régulière sont difficiles.

    Quant au front tigréen, il a vraisemblablement envisagé une position de repli dans la guerrilla, avec des forces aguerries, dans une région qui lui est acquise.

    Reste l’attitude des pays de la région, qui risquent d’être entrainés dans cette #guerre_civile, à commencer par l’Érythrée voisine, déjà touchée par les hostilités.

    C’est une tragédie pour l’Éthiopie, mais aussi pour l’Afrique, car c’est le deuxième pays le plus peuplé du continent, siège de l’Union africaine, l’une des locomotives d’une introuvable renaissance africaine. L’Afrique doit tout faire pour mettre fin à cette guerre fratricide, aux conséquences dévastatrices.

    https://www.franceinter.fr/emissions/geopolitique/geopolitique-23-novembre-2020

    #Ethiopie #Tigré #Corne_de_l'Afrique #Tigray

    • Conflict between Tigray and Eritrea – the long standing faultline in Ethiopian politics

      The missile attack by the Tigray People’s Liberation Front on Eritrea in mid-November transformed an internal Ethiopian crisis into a transnational one. In the midst of escalating internal conflict between Ethiopia’s northernmost province, Tigray, and the federal government, it was a stark reminder of a historical rivalry that continues to shape and reshape Ethiopia.

      The rivalry between the Tigray People’s Liberation Front and the movement which has governed Eritrea in all but name for the past 30 years – the Eritrean People’s Liberation Front – goes back several decades.

      The histories of Eritrea and Ethiopia have long been closely intertwined. This is especially true of Tigray and central Eritrea. These territories occupy the central massif of the Horn of Africa. Tigrinya-speakers are the predominant ethnic group in both Tigray and in the adjacent Eritrean highlands.

      The enmity between the Tigray People’s Liberation Front and the Eritrean People’s Liberation Front dates to the mid-1970s, when the Tigrayan front was founded in the midst of political turmoil in Ethiopia. The authoritarian Marxist regime – known as the Derg (Amharic for ‘committee’) – inflicted violence upon millions of its own citizens. It was soon confronted with a range of armed insurgencies and socio-political movements. These included Tigray and Eritrea, where the resistance was most ferocious.

      The Tigrayan front was at first close to the Eritrean front, which had been founded in 1970 to fight for independence from Ethiopia. Indeed, the Eritreans helped train some of the first Tigrayan recruits in 1975-6, in their shared struggle against Ethiopian government forces for social revolution and the right to self-determination.

      But in the midst of the war against the Derg regime, the relationship quickly soured over ethnic and national identity. There were also differences over the demarcation of borders, military tactics and ideology. The Tigrayan front eventually recognised the Eritreans’ right to self-determination, if grudgingly, and resolved to fight for the liberation of all Ethiopian peoples from the tyranny of the Derg regime.

      Each achieved seminal victories in the late 1980s. Together the Tigrayan-led Ethiopian People’s Revolutionary Democratic Front and the Eritrean front overthrew the Derg in May 1991. The Tigrayan-led front formed government in Addis Ababa while the Eritrean front liberated Eritrea which became an independent state.

      But this was just the start of a new phase of a deep-rooted rivalry. This continued between the governments until the recent entry of prime minister Abiy Ahmed.

      If there’s any lesson to be learnt from years of military and political manoeuvrings, it is that conflict in Tigray is unavoidably a matter of intense interest to the Eritrean leadership. And Abiy would do well to remember that conflict between Eritrea and Tigray has long represented a destabilising fault line for Ethiopia as well as for the wider region.
      Reconciliation and new beginnings

      In the early 1990s, there was much talk of reconciliation and new beginnings between Meles Zenawi of Ethiopia and Isaias Afeworki of Eritrea. The two governments signed a range of agreements on economic cooperation, defence and citizenship. It seemed as though the enmity of the liberation war was behind them.

      Meles declared as much at the 1993 Eritrean independence celebrations, at which he was a notable guest.

      But deep-rooted tensions soon resurfaced. In the course of 1997, unresolved border disputes were exacerbated by Eritrea’s introduction of a new currency. This had been anticipated in a 1993 economic agreement. But in the event Tigrayan traders often refused to recognise it, and it caused a collapse in commerce.

      Full-scale war erupted over the contested border hamlet of Badme in May 1998. The fighting swiftly spread to other stretches of the shared, 1,000 km long frontier. Air strikes were launched on both sides.

      It was quickly clear, too, that this was only superficially about borders. It was more substantively about regional power and long standing antagonisms that ran along ethnic lines.

      The Eritrean government’s indignant anti-Tigray front rhetoric had its echo in the popular contempt for so-called Agame, the term Eritreans used for Tigrayan migrant labourers.

      For the Tigray front, the Eritrean front was the clearest expression of perceived Eritrean arrogance.

      As for Isaias himself, regarded as a crazed warlord who had led Eritrea down a path which defied economic and political logic, it was hubris personified.

      Ethiopia deported tens of thousands of Eritreans and Ethiopians of Eritrean descent.

      Ethiopia’s decisive final offensive in May 2000 forced the Eritrean army to fall back deep into their own territory. Although the Ethiopians were halted, and a ceasefire put in place after bitter fighting on a number of fronts, Eritrea had been devastated by the conflict.

      The Algiers Agreement of December 2000 was followed by years of standoff, occasional skirmishes, and the periodic exchange of insults.

      During this period Ethiopia consolidated its position as a dominant power in the region. And Meles as one of the continent’s representatives on the global stage.

      For its part Eritrea retreated into a militaristic, authoritarian solipsism. Its domestic policy centred on open-ended national service for the young. Its foreign policy was largely concerned with undermining the Ethiopian government across the region. This was most obvious in Somalia, where its alleged support for al-Shabaab led to the imposition of sanctions on Asmara.

      The ‘no war-no peace’ scenario continued even after Meles’s sudden death in 2012. The situation only began to shift with the resignation of Hailemariam Desalegn against a backdrop of mounting protest across Ethiopia, especially among the Oromo and the Amhara, and the rise to power of Abiy.

      What followed was the effective overthrow of the Tigray People’s Liberation Front which had been the dominant force in the Ethiopian People’s Revolutionary Democratic Front coalition since 1991.

      This provided Isaias with a clear incentive to respond to Abiy’s overtures.
      Tigray’s loss, Eritrea’s gain

      A peace agreement between Ethiopia and Eritrea, was signed in July 2018 by Abiy and Eritrean President Isaias Afeworki. It formally ended their 1998-2000 war. It also sealed the marginalisation of the Tigray People’s Liberation Front. Many in the Tigray People’s Liberation Front were unenthusiastic about allowing Isaias in from the cold.

      Since the 1998-2000 war, in large part thanks to the astute manoeuvres of the late Prime Minister Meles Zenawi, Eritrea had been exactly where the Tigray People’s Liberation Front wanted it: an isolated pariah state with little diplomatic clout. Indeed, it is unlikely that Isaias would have been as receptive to the deal had it not involved the further sidelining of the Tigray People’s Liberation Front, something which Abiy presumably understood.

      Isaias had eschewed the possibility of talks with Abiy’s predecessor, Hailemariam Desalegn. But Abiy was a different matter. A political reformer, and a member of the largest but long-subjugated ethnic group in Ethiopia, the Oromo, he was determined to end the Tigray People’s Liberation Front’s domination of Ethiopian politics.

      This was effectively achieved in December 2019 when he abolished the Ethiopian People’s Revolutionary Democratic Front and replaced it with the Prosperity Party.

      The Tigray People’s Liberation Front declined to join with the visible results of the current conflict.

      À lire aussi : Residual anger driven by the politics of power has boiled over into conflict in Ethiopia

      Every effort to engage with the Tigrayan leadership – including the Tigray People’s Liberation Front – in pursuit of a peaceful resolution must also mean keeping Eritrea out of the conflict.

      Unless Isaias is willing to play a constructive role – he does not have a good track record anywhere in the region in this regard – he must be kept at arm’s length, not least to protect the 2018 peace agreement itself.

      https://theconversation.com/conflict-between-tigray-and-eritrea-the-long-standing-faultline-in-

      #Derg #histoire #frontières #démarcation_des_frontières #monnaie #Badme #Agame #travailleurs_étrangers #Oromo #Ethiopian_People’s_Revolutionary_Democratic_Front #Prosperity_Party

      –—

      #Agame , the term Eritreans used for Tigrayan migrant labourers.

      –-> #terminologie #vocabulaire #mots
      ping @sinehebdo

    • Satellite Images Show Ethiopia Carnage as Conflict Continues
      – United Nations facility, school, clinic and homes burned down
      – UN refugee agency has had no access to the two camps

      Satellite images show the destruction of United Nations’ facilities, a health-care unit, a high school and houses at two camps sheltering Eritrean refugees in Tigray, northern Ethiopia, belying government claims that the conflict in the dissident region is largely over.

      The eight Planet Labs Inc images are of Hitsats and the Shimelba camps. The camps hosted about 25,000 and 8,000 refugees respectively before a conflict broke out in the region two months ago, according to data from the United Nations High Commissioner for Refugees.

      “Recent satellite imagery indicates that structures in both camps are being intentionally targeted,” said Isaac Baker, an analyst at DX Open Network, a U.K. based human security research and analysis non-profit. “The systematic and widespread fires are consistent with an intentional campaign to deny the use of the camp.”

      DX Open Network has been following the conflict and analyzing satellite image data since Nov. 7, three days after Ethiopian Prime Minister Abiy Ahmed declared war against a dissident group in the Tigray region, which dominated Ethiopian politics before Abiy came to power.

      Ethiopia’s government announced victory against the dissidents on Nov. 28 after federal forces captured the regional capital of Mekelle. Abiy spoke of the need to rebuild and return normalcy to Tigray at the time.

      Calls and messages to Redwan Hussein, spokesman for the government’s emergency task force on Tigray and the Prime Minister Abiy Ahmed’s Spokeswoman Billene Seyoum were not answered.

      In #Shimelba, images show scorched earth from apparent attacks in January. A World Food Programme storage facility and a secondary school run by the Development and Inter-Aid Church Commission have also been burned down, according to DX Open Network’s analysis. In addition, a health facility run by the Ethiopian Agency for Refugees and Returnees Affairs situated next to the WFP compound was also attacked between Jan. 5 and Jan. 8.

      In #Hitsats camp, about 30 kilometers (19 miles) away, there were at least 14 actively burning structures and 55 others were damaged or destroyed by Jan. 5. There were new fires by Jan. 8, according to DX Open Network’s analysis.

      The UN refugee agency has not had access to the camps since fighting started in early November, according to Chris Melzer, a communications officer for the agency. UNHCR has been able to reach its two other camps, Mai-Aini and Adi Harush, which are to the south, he said.

      “We also have no reliable, first-hand information about the situation in the camps or the wellbeing of the refugees,” Melzer said in reference to Hitsats and Shimelba.

      Eritrean troops have also been involved in the fighting and are accused of looting businesses and abducting refugees, according to aid workers and diplomats briefed on the situation. The governments of both Ethiopia and Eritrea have denied that Eritrean troops are involved in the conflict.

      The UN says fighting is still going on in several Tigray areas and 2.2 million people have been displaced in the past two months. Access to the region for journalists and independent analysts remains constrained, making it difficult to verify events.

      https://www.bloomberg.com/news/articles/2021-01-09/satellite-images-show-destruction-of-refugee-camps-in-ethiopia?srnd=premi

      #images_satellitaires #camps_de_réfugiés #réfugiés

    • Ethiopia’s government appears to be wielding hunger as a weapon

      A rebel region is being starved into submission

      ETHIOPIA HAS suffered famines in the past. Many foreigners know this; in 1985 about one-third of the world’s population watched a pop concert to raise money for starving Ethiopians. What is less well understood is that poor harvests lead to famine only when malign rulers allow it. It was not the weather that killed perhaps 1m people in 1983-85. It was the policies of a Marxist dictator, Mengistu Haile Mariam, who forced peasants at gunpoint onto collective farms. Mengistu also tried to crush an insurgency in the northern region of Tigray by burning crops, destroying grain stores and slaughtering livestock. When the head of his own government’s humanitarian agency begged him for cash to feed the starving, he dismissed him with a memorably callous phrase: “Don’t let these petty human problems...consume you.”

      https://www.economist.com/leaders/2021/01/23/ethiopias-government-appears-to-be-wielding-hunger-as-a-weapon

      #famine #faim
      #paywall

    • Amnesty International accuses Eritrean troops of killing hundreds of civilians in the holy city of #Axum

      Amnesty International has released a comprehensive, compelling report detailing the killing of hundreds of civilians in the Tigrayan city of Axum.

      This story has been carried several times by Eritrea Hub, most recently on 20th February. On 12 January this year the Axum massacre was raised in the British Parliament, by Lord David Alton.

      Gradually the picture emerging has been clarified and is now unambiguous.

      The Amnesty report makes grim reading: the details are horrifying.

      Human Rights Watch are finalising their own report, which will be published next week. The Ethiopian Human Rights Commission is also publishing a report on the Axum massacre.

      The Ethiopian government appointed interim administration of Tigray is attempting to distance itself from the actions of Eritrean troops. Alula Habteab, who heads the interim administration’s construction, road and transport department, appeared to openly criticise soldiers from Eritrea, as well as the neighbouring Amhara region, for their actions during the conflict.

      “There were armies from a neighbouring country and a neighbouring region who wanted to take advantage of the war’s objective of law enforcement,” he told state media. “These forces have inflicted more damage than the war itself.”

      The full report can be found here: The Massacre in Axum – AFR 25.3730.2021. Below is the summary (https://eritreahub.org/wp-content/uploads/2021/02/The-Massacre-in-Axum-AFR-25.3730.2021.pdf)

      https://eritreahub.org/amnesty-international-accuses-eritrean-troops-of-killing-hundreds-of-civ

      #rapport #massacre

    • Ethiopia’s Tigray crisis: How a massacre in the sacred city of #Aksum unfolded

      Eritrean troops fighting in Ethiopia’s northern region of Tigray killed hundreds of people in Aksum mainly over two days in November, witnesses say.

      The mass killings on 28 and 29 November may amount to a crime against humanity, Amnesty International says in a report.

      An eyewitness told the BBC how bodies remained unburied on the streets for days, with many being eaten by hyenas.

      Ethiopia and Eritrea, which both officially deny Eritrean soldiers are in Tigray, have not commented.

      The Ethiopian Human Rights commission says it is investigating the allegations.

      The conflict erupted on 4 November 2020 when Ethiopia’s government launched an offensive to oust the region’s ruling TPLF party after its fighters captured federal military bases in Tigray.

      Ethiopia’s Prime Minister Abiy Ahmed, a Nobel Peace Prize winner, told parliament on 30 November that “not a single civilian was killed” during the operation.

      But witnesses have recounted how on that day they began burying some of the bodies of unarmed civilians killed by Eritrean soldiers - many of them boys and men shot on the streets or during house-to-house raids.

      Amnesty’s report has high-resolution satellite imagery from 13 December showing disturbed earth consistent with recent graves at two churches in Aksum, an ancient city considered sacred by Ethiopia’s Orthodox Christians.

      A communications blackout and restricted access to Tigray has meant reports of what has gone on in the conflict have been slow to emerge.

      In Aksum, electricity and phone networks reportedly stopped working on the first day of the conflict.
      How was Aksum captured?

      Shelling by Ethiopian and Eritrea forces to the west of Aksum began on Thursday 19 November, according to people in the city.

      “This attack continued for five hours, and was non-stop. People who were at churches, cafes, hotels and their residence died. There was no retaliation from any armed force in the city - it literally targeted civilians,” a civil servant in Aksum told the BBC.
      1px transparent line

      Amnesty has gathered similar and multiple testimonies describing the continuous shelling that evening of civilians.

      Once in control of the city, soldiers, generally identified as Eritrean, searched for TPLF soldiers and militias or “anyone with a gun”, Amnesty said.

      “There were a lot of... house-to-house killings,” one woman told the rights group.

      There is compelling evidence that Ethiopian and Eritrean troops carried out “multiple war crimes in their offensive to take control of Aksum”, Amnesty’s Deprose Muchena says.
      What sparked the killings?

      For the next week, the testimonies say Ethiopia troops were mainly in Aksum - the Eritreans had pushed on east to the town of Adwa.

      A witness told the BBC how the Ethiopian military looted banks in the city in that time.

      he Eritrean forces reportedly returned a week later. The fighting on Sunday 28 November was triggered by an assault of poorly armed pro-TPLF fighters, according to Amnesty’s report.

      Between 50 and 80 men from Aksum targeted an Eritrean position on a hill overlooking the city in the morning.

      A 26-year-old man who participated in the attack told Amnesty: “We wanted to protect our city so we attempted to defend it especially from Eritrean soldiers... They knew how to shoot and they had radios, communications... I didn’t have a gun, just a stick.”
      How did Eritrean troops react?

      It is unclear how long the fighting lasted, but that afternoon Eritrean trucks and tanks drove into Aksum, Amnesty reports.

      Witnesses say Eritrean soldiers went on a rampage, shooting at unarmed civilian men and boys who were out on the streets - continuing until the evening.

      A man in his 20s told Amnesty about the killings on the city’s main street: “I was on the second floor of a building and I watched, through the window, the Eritreans killing the youth on the street.”

      The soldiers, identified as Eritrean not just because of their uniform and vehicle number plates but because of the languages they spoke (Arabic and an Eritrean dialect of Tigrinya), started house-to-house searches.

      “I would say it was in retaliation,” a young man told the BBC. “They killed every man they found. If you opened your door and they found a man they killed him, if you didn’t open, they shoot your gate by force.”

      He was hiding in a nightclub and witnessed a man who was found and killed by Eritrean soldiers begging for his life: “He was telling them: ’I am a civilian, I am a banker.’”

      Another man told Amnesty that he saw six men killed, execution-style, outside his house near the Abnet Hotel the following day on 29 November.

      “They lined them up and shot them in the back from behind. Two of them I knew. They’re from my neighbourhood… They asked: ’Where is your gun’ and they answered: ’We have no guns, we are civilians.’”
      How many people were killed?

      Witnesses say at first the Eritrean soldiers would not let anyone approach the bodies on the streets - and would shoot anyone who did so.

      One woman, whose nephews aged 29 and 14 had been killed, said the roads “were full of dead bodies”.

      Amnesty says after the intervention of elders and Ethiopian soldiers, burials began over several days, with most funerals taking place on 30 November after people brought the bodies to the churches - often 10 at a time loaded on horse- or donkey-drawn carts.

      At Abnet Hotel, the civil servant who spoke to the BBC said some bodies were not removed for four days.

      "The bodies that were lying around Abnet Hotel and Seattle Cinema were eaten by hyenas. We found only bones. We buried bones.

      “I can say around 800 civilians were killed in Aksum.”

      This account is echoed by a church deacon who told the Associated Press that many bodies had been fed on by hyenas.

      He gathered victims’ identity cards and assisted with burials in mass graves and also believes about 800 people were killed that weekend.

      The 41 survivors and witnesses Amnesty interviewed provided the names of more than 200 people they knew who were killed.
      What happened after the burials?

      Witnesses say the Eritrean soldiers participated in looting, which after the massacre and as many people fled the city, became widespread and systematic.

      The university, private houses, hotels, hospitals, grain stores, garages, banks, DIY stores, supermarkets, bakeries and other shops were reportedly targeted.

      One man told Amnesty how Ethiopian soldiers failed to stop Eritreans looting his brother’s house.

      “They took the TV, a jeep, the fridge, six mattresses, all the groceries and cooking oil, butter, teff flour [Ethiopia’s staple food], the kitchen cabinets, clothes, the beers in the fridge, the water pump, and the laptop.”

      The young man who spoke to the BBC said he knew of 15 vehicles that had been stolen belonging to businessmen in the city.

      This has had a devastating impact on those left in Aksum, leaving them with little food and medicine to survive, Amnesty says.

      Witnesses say the theft of water pumps left residents having to drink from the river.
      Why is Aksum sacred?

      It is said to be the birthplace of the biblical Queen of Sheba, who travelled to Jerusalem to visit King Solomon.

      They had a son - Menelik I - who is said to have brought to Aksum the Ark of the Covenant, believed to contain the 10 commandments handed down to Moses by God.

      It is constantly under guard at the city’s Our Lady Mary of Zion Church and no-one is allowed to see it.

      A major religious celebration is usually held at the church on 30 November, drawing pilgrims from across Ethiopia and around the world, but it was cancelled last year amid the conflict.

      The civil servant interviewed by the BBC said that Eritrean troops came to the church on 3 December “terrorising the priests and forcing them to give them the gold and silver cross”.

      But he said the deacons and other young people went to protect the ark.

      “It was a huge riot. Every man and woman fought them. They fired guns and killed some, but we are happy as we did not fail to protect our treasures.”

      https://www.bbc.com/news/world-africa-56198469

  • CNES Géoimage Nouvelles ressources

    Dans une situation difficile, tendue et régressive, les cours en présentiel sont impossibles, les bibliothèques, universitaires en particulier, et les librairies sont fermées et les risques de décrochages se multiplient. Dans ce contexte, le site Géoimage du CNES (Centre Nat. d’Etudes Spatiales) met à disposition en ligne plus de 300 dossiers réalisés par 165 auteurs sur 86 pays et territoires. Pour votre information, voici les derniers dossiers réalisés ces deux derniers mois. Ils constituent peut être une ressource utile pour vos étudiants. En restant a votre disposition.

    1. Nouveaux dossiers en ligne

    #Frontières : entre #guerres, #tensions et #coopérations

    #Pakistan-#Inde-#Chine. Le massif du #K2 et le #Glacier_Siachen : #conflits_frontaliers et affrontements militaires sur le « toit du monde » (L. Carroué )

    https://geoimage.cnes.fr/fr/pakistan-inde-chine-le-massif-du-k2-et-le-glacier-siachen-conflits-fro

    Pakistan-Chine. La #Karakoram_Highway : un axe transfrontalier géostratégique à travers l’#Himalaya (L. Carroué)

    https://geoimage.cnes.fr/fr/geoimage/pakistan-chine-la-karakoram-highway-un-axe-transfrontalier-geostrategi

    #Afghanistan/ #Pakistan/ #Tadjikistan - Le corridor de #Wakhan : une zone tampon transfrontalière en plein Himalaya (L. Carroué)

    https://geoimage.cnes.fr/fr/afghanistan-pakistan-tadjikistan-le-corridor-de-wakhan-une-zone-tampon

    Affrontement aux sommets sur la frontière sino-indienne, autour du #Lac_Pangong_Tso dans l’Himalaya (F. Vergez)

    https://geoimage.cnes.fr/fr/geoimage/affrontement-aux-sommets-sur-la-frontiere-sino-indienne-sur-le-lac-pan

    #Brésil - #Argentine#Paraguay. La triple frontière autour d’#Iguazu : un des territoires transfrontaliers les plus actifs au monde (C. Loïzzo)

    https://geoimage.cnes.fr/fr/geoimage/bresil-argentine-paraguay-la-triple-frontiere-autour-diguazu-un-des-te

    #Grèce#Turquie. Les îles grecques de #Samos et #Lesbos en #mer_Egée : tensions géopolitiques frontalières et flux migratoires (F. Vergez)

    https://geoimage.cnes.fr/fr/geoimage/grece-turquie-les-iles-grecques-de-samos-et-lesbos-en-mer-egee-tension

    #Jordanie/ #Syrie : guerre civile, frontière militarisée et #camps_de_réfugiés de #Zaatari (L. Carroué)

    https://geoimage.cnes.fr/fr/geoimage/jordanie-syrie-guerre-civile-frontiere-militarisee-et-camps-de-refugie

    Frontières : France métropolitaine et outre-mer

    #Calais : un port de la façade maritime européenne aux fonctions transfrontalières transmanches (L. Carbonnier et A. Gack)

    https://geoimage.cnes.fr/fr/geoimage/hauts-de-france-calais-un-port-de-la-facade-maritime-europeenne-aux-fo

    L’Est-#Maralpin : un territoire transfrontalier franco-italo-monégaste au cœur de l’arc méditerranéen (F. Boizet et L. Clerc)

    https://geoimage.cnes.fr/fr/lest-maralpin-un-territoire-transfrontalier-franco-italo-monegaste-au-

    La principauté de #Monaco : le défi du territoire, entre limite frontalière, densification et extensions urbaines maritimes (P. Briand)

    https://geoimage.cnes.fr/fr/geoimage/la-principaute-de-monaco-le-defi-du-territoire-entre-limite-frontalier

    #Guyane_française/ Brésil. La frontière : d’un territoire longtemps contesté à une difficile coopération régionale transfrontalière (P. Blancodini )

    https://geoimage.cnes.fr/fr/geoimage/guyane-francaise-bresil-la-frontiere-un-territoire-longtemps-conteste-

    (Frontières. Pages concours - Capes, Agrégations)

    https://geoimage.cnes.fr/fr/geoimage/les-frontieres

    Enjeux géostratégiques et géopolitiques

    Pakistan. #Gwadar : un port chinois des Nouvelles Routes de la Soie dans un #Baloutchistan désertique et instable (C. Loïzzo)

    https://geoimage.cnes.fr/fr/geoimage/pakistan-gwadar-un-port-chinois-des-nouvelles-routes-de-la-soie-dans-u

    #Chine. L’archipel des #Paracels : construire des #îles pour projeter sa puissance et contrôler la #Mer_de_Chine méridionale (L. Carroué)

    Chine - L’archipel des Paracels : construire des îles pour projeter sa puissance et contrôler la Mer de Chine méridionale

    #Kings_Bay : la grande base sous-marine nucléaire stratégique de l’#Atlantique (L. Carroué)

    https://geoimage.cnes.fr/fr/geoimage/etats-unis-kings-bay-la-grande-base-sous-marine-nucleaire-strategique-

    #Kitsap - #Bangor : la plus grande #base_sous-marine nucléaire stratégique au monde (L. Carroué)

    https://geoimage.cnes.fr/fr/geoimage/etats-unis-kitsap-bangor-la-plus-grande-base-sous-marine-nucleaire-str

    #Djibouti / #Yémen. Le détroit de #Bab_el-Mandeb : un verrou maritime géostratégique entre la #mer_Rouge et l’#océan_Indien (E. Dallier et P. Denmat)

    https://geoimage.cnes.fr/fr/geoimage/djiboutiyemen-le-detroit-de-bab-el-mandeb-un-verrou-maritime-geostrate

    #Abu_Dhabi : une ville capitale, entre mer et désert (F. Tétart)

    https://geoimage.cnes.fr/fr/geoimage/emirats-arabes-unis-abu-dhabi-une-ville-capitale-entre-mer-et-desert

    France et #DROM : dynamiques et mutations

    Languedoc. #Cap_d’Agde : une station touristique au sein d’un littoral très aménagé en région viticole (Y. Clavé)

    https://geoimage.cnes.fr/fr/geoimage/languedoc-cap-dagde-une-station-touristique-au-sein-dun-littoral-tres-

    Le sud-est de la #Grande-Terre : les plages touristiques et les #Grands_Fonds, entre survalorisation, inégalités et développement durable (J. Fieschi et E. Mephara)

    https://geoimage.cnes.fr/fr/geoimage/guadeloupe-le-sud-est-de-la-grande-terre-les-plages-touristiques-et-le

    #Normandie. #Lyons-la-Forêt et son environnement : entre #Rouen et Paris, un espace rural sous emprise forestière (T. Puigventos)

    https://geoimage.cnes.fr/fr/geoimage/normandie-lyons-la-foret-et-son-environnement-entre-rouen-et-paris-un-

    #PACA. L’agglomération de #Fréjus - #Saint-Raphaël : un #littoral méditerranéen touristique urbanisé (S. Revert)

    https://geoimage.cnes.fr/fr/geoimage/paca-lagglomeration-de-frejus-saint-raphael-un-littoral-mediterraneen-

    #Tourisme et #patrimonialisation dans le monde

    #Portugal#Lisbonne : la capitale portugaise aux défis d’une #touristification accélérée et d’une patrimonialisation accrue (J. Picollier)

    Portugal - Lisbonne : la capitale portugaise aux défis d’une touristification accélérée et d’une patrimonialisation accrue

    #Floride : le Sud-Ouest, un nouveau corridor touristique et urbain (J.F. Arnal)

    https://geoimage.cnes.fr/fr/geoimage/etats-unis-floride-le-sud-ouest-un-nouveau-corridor-touristique-et-urb

    #Alaska. Le #Mont_Denali : glaciers, #parc_national, #wilderness et changement climatique (A. Poiret)

    https://geoimage.cnes.fr/fr/geoimage/alaska-le-mont-denali-glaciers-parc-national-wilderness-et-changement-

    #Ile_Maurice. Le miracle de l’émergence d’une petite île de l’#océan_Indien (M. Lachenal)

    https://geoimage.cnes.fr/fr/geoimage/ile-maurice-le-miracle-de-lemergence-dune-petite-ile-de-locean-indien

    Le #Grand-Prismatic du Parc National du #Yellowstone : entre wilderness, protection, patrimonialisation et tourisme de masse (S. Sangarne et N. Vermersch)

    https://geoimage.cnes.fr/fr/geoimage/etats-unis-le-grand-prismatic-du-parc-national-du-yellowstone-entre-wi

    #Maroc. Contraintes, défis et potentialités d’un espace désertique marocain en bordure du Sahara : Ouarzazate (M. Lachenal)

    https://geoimage.cnes.fr/fr/geoimage/maroc-contraintes-defis-et-potentialites-dun-espace-desertique-marocai

    2. Nouvelle rubrique : « Images A la Une »

    La rubrique Image A La Une a pour objectif de mettre en ligne une image satellite accompagnée d’un commentaire en lien avec un point d’actualité et qui peut donc être facilement mobilisée en cours (cf. incendies de forêt en Australie en janv./ 2020, impact du Coronavirus en avril 2020).

    Fabien Vergez : Affrontements aux sommets sur la frontière sino-indienne, sur le lac Pangong Tso dans l’Himalaya

    https://geoimage.cnes.fr/fr/geoimage/affrontement-aux-sommets-sur-la-frontiere-sino-indienne-sur-le-lac-pan

    Virginie Estève : Les "#Incendies_zombies" en #Arctique : un phénomène surmédiatisé qui alerte sur le réchauffement climatique.

    https://geoimage.cnes.fr/fr/geoimage/incendies-zombies-en-arctique-un-phenomene-surmediatise-qui-alerte-sur

    3. Ouverture d’une nouvelle rubrique : « La satellithèque »

    Le site Géoimage du CNES se dote d’une nouvelle rubrique afin d’enrichir son offre. A côté des images déjà proposées dans les rubriques "dossiers thématiques" ou "Images A la Une", le site Géoimage du CNES met en ligne comme autres ressources des images brutes non accompagnées d’un commentaire ou d’une analyse.

    L’objectif de cette #Satellithèque est d’offrir au plus grand nombre - enseignants, universitaires, chercheurs, étudiants, grand public... - de nombreuses images de la France et du monde. Ainsi, progressivement, dans les mois qui viennent des centaines d’images nouvelles seront disponibles et téléchargeable directement et gratuitement en ligne afin d’accompagner leurs travaux, recherches ou voyages.

    https://geoimage.cnes.fr/fr/geoimage/satellitheque

    4. Ouverture de comptes Twitter et Instagram

    Suivez et partagez l’actualité du site GeoImage à travers Twitter / Instagram, que ce soit de nouvelles mises en ligne ou des évènements autour de ce projet. La publication de nouveaux dossiers et leurs référencements, tout comme la publication de notules dans images à la une est accompagnée de brèves sur ces réseaux sociaux

    Ci-dessous les identifiants pour s’abonner aux comptes Twitter et Instagram

    Compte twitter : @Geoimage_ed

    Compte Instagram : geoimage_ed

    #images_satellitaires #visualisation

    #ressources_pédagogiques

  • Open-source #satellite data to investigate #Xinjiang concentration camps

    The second part of this series discusses techniques on how to analyse a dire human rights situation in and around Xinjiang’s re-education and detention facilities.

    A pressing need to investigate characteristics of Xinjiang’s detention camps

    The story has been widely covered. Calls by human rights advocates to define China’s practices as ‘genocide’ grow louder. Hundreds of thousands of Uighurs, Kazakhs and other Muslims detained in internment camps. Many still are.

    “Inmates undergo months or years of indoctrination and interrogation aimed at transforming them into secular and loyal supporters of the party”, the New York Times wrote and published documents that unmistakably prove a dire human rights situation in the west of China.

    First China denied the camps ever existed. Then the Chinese consulate doesn’t bother anymore to play a smoke and mirror game and admits: “Xinjiang has set up vocational education and training centres in order to root out extreme thoughts…”. Their purpose: ‘compulsory programs for terrorist criminals’.

    Now, the language changed again. China’s President said the ‘strategy for governing Xinjiang in the new era is completely correct.’

    Unacceptable (and unwise) of some to deny it. Social media commentators, some who are frequently quoted by large media organisations, keep casting doubt on the tragic story. Margaret_Kimberley tweeted — after an ITV news report emerged — “These are lies. There is no evidence of Uighur concentration camps. More hybrid war against China” (it received 2,000 likes).

    While there is no room left to doubt that these camps do exist, there remains vast uncertainty whether investigative journalists and human rights advocates located all facilities spread out across the province.

    Researchers/journalists who made it their beat to find them, like Nathan Ruser at Australian Strategic Policy Institute (ASPI), says “we don’t believe that we have found them all”, after posting 380 facilities online.

    Germany’s chancellor last week said China’s President Xi offered delegates to send envoys to visit Xinjiang province [and camps] to see for themselves. Chances increase to see more of the so-called ‘show camps’ for a short period of time or as long as the visits take (the BBC encountered it when it visited last time). Xi also ensured that there will be an ‘ongoing human-rights dialogue’. But Ursula von der Leyen tweeted “a lot remains to be done .. in other chapters of our relations”.

    Satelite investigations exposing more and more evidence. OSINT journalists rely on them. It’s one reason why some open-source intelligence journalism colleagues keep hearing rumours that some of the camps may have moved underground (e.g. detention in under-surface facilities) to hide from the spying eyes and scrutiny of satellite data analysts (we don’t have proof for this thesis but I encourage you to reach out if you have evidence).
    Mounting number of facilities

    The number of confirmed facilities steadily grew. A 2018 BBC investigation looked at 101 campsites, which got pinpointed via various media reports and academic research, the author says.

    Most recently, Buzzfeed investigated 268 compounds, many from previous lists I worked on too. In February, the list of ‘confirmed re-education camps’, so lower-security sites, mainly for indoctrination purposes, was limited to mere 50 facilities. ‘Confirmed’ in this context means they have been validated by eye-witness reports. Back then, there were another 170 that had yet to be confirmed.

    It is of vital importance to keep this investigation rolling. This means to forensically document the changes in these camps and to spend more time on characterizing each detail. ASPI just dropped a new list and we are going to work with that one instead of the original 50 we received (the list can be downloaded here and geodata that can be simply dragged and dropped into QGIS and Google Earth Pro, it is available here).

    Finally, news broke via Reuters (and research by Adrian Zenz) that evidence of forced labour is mounting also in Tibet (we will look into this later, too).
    List of ‘expanded camps’ extended

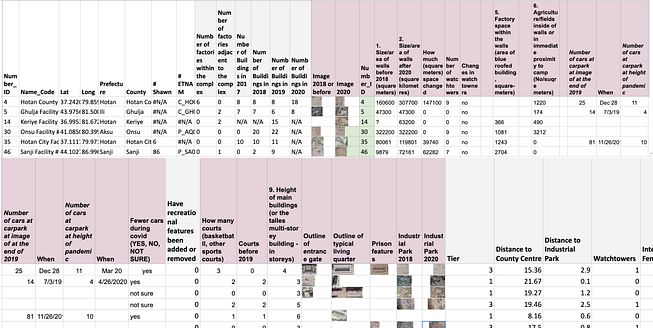
    Earlier in the year US-based Uighure group ETNAM shared a list with around 50 confirmed sites. We and others scrutinised this list on increased activity on the ground via aggregated satellite remote sensing data (link). The list was shared as klm. file. It helped enormously with going through them one by one. All the coordinates as well as the Chinese names of the places are accessible via Google Earth Pro. Now that ASPI dropped a new list with coordinates and updated 2020 records, some of the work we have started can be extended and match.

    Because we are most interested in the camps that got expanded (so buildings or features were added), we will concentrate on the list of facilities that were developed. It includes a list of 61 sites.

    Why is the onus on expanded camps? In addition to the characteristics ASPI added as classifiers, the extended camps might tell us where the local administration invests and where forced labour in the firm of Uighur prisoners went. We added a few more details for each facility that we thought was worth looking at (see sheet above).
    We will go through various ways to characterise/investigate facilities and their surroundings

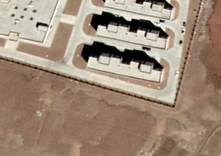
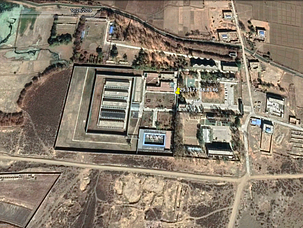
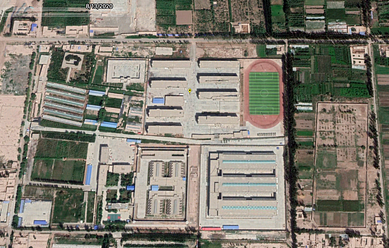
    First significant markers includes the size of the camps. That includes quantitative details such as the number of buildings on the premise and adjacent to it. We will go through how to compare them. There are the walls of camps that are usually quite straight-lined. Their height, which we will define and validate, and the walls’ thickness may tell us something about recent developments (e.g. how secure the sites are, or were meant to be).

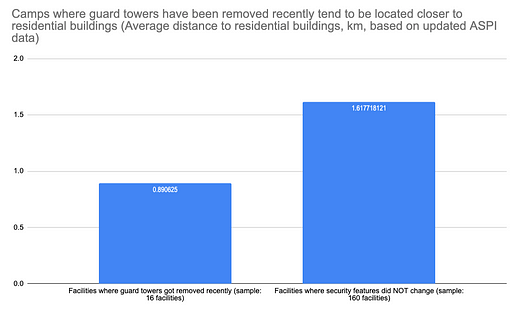
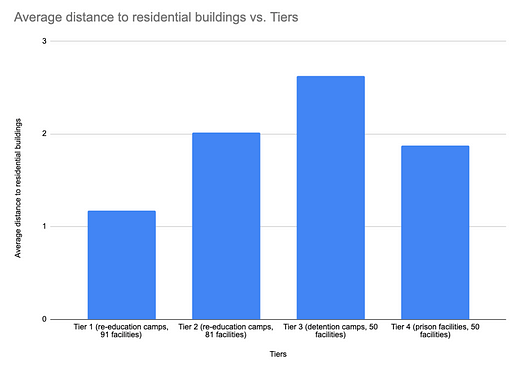
    Guard towners are also a quantifiable element. ASPI and others counted them. Because they can be seen from outside they may act as a signal to local residents. That is also likely the reason why those facilities that have some or all of their towers removed recently tend to locate closer to residential buildings (see my stats below).

    These changes are further revealing as they may tell us something about how the local government in various parts of the region varied in their response to international pressure (or not, by keeping them in place). ‘A lot [camps] had their security features removed in the second half of 2019’, Zenz explained. Some remained in place (important to add here, it remains doubtful that conditions improved inside of the camps, even if towers or security features were removed).

    Zenz has an explanation for some of the changes: “On the same time they invited all these delegations and visitors, they released a lot of people. If you release a lot of people, you can afford to run with fewer security features. That can still be run like an internment camp, I’m sure”. We will look closer at what has changed ourselves.

    Including those features above, there are a number of other aspects to take into account. We put them into the list below — each will be discussed separately:

    What blue factory buildings in and around camps can tell us
    What typical ‘prison features’ tell us
    What cars in parking lots tell us about personnel working at the facilities during Covid-19
    What walls can tell us
    What guard towers can tell us
    What sports facilities can tell us
    What the shapes/types of buildings and location can tell us
    What agricultural space (e.g. fields) around the camps can tell us
    What potential crematory sites reveal
    What Xinjiang’s export tell us
    What population/urbanisation numbers tell us about internment and surveillance
    What Baidu maps can tell us

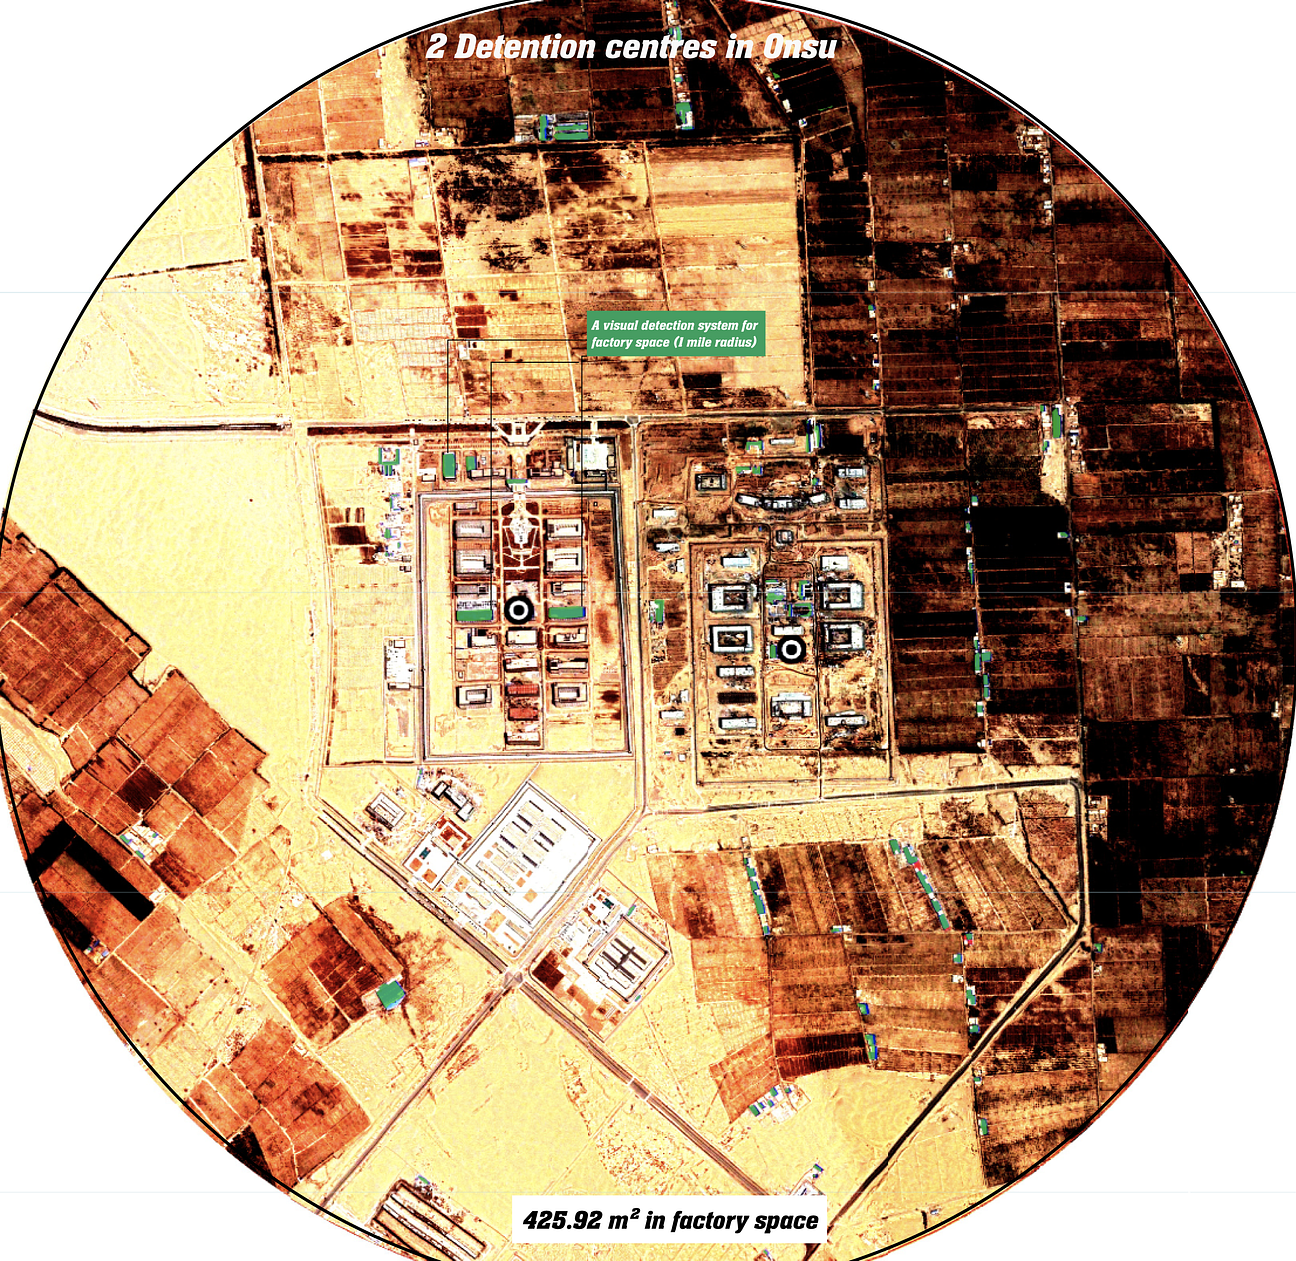
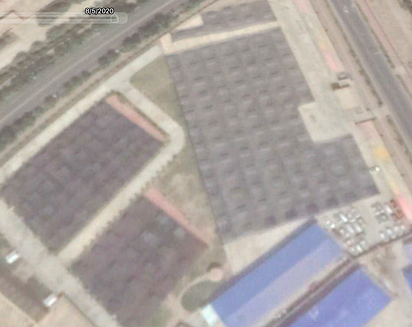
    Blue-roofed factory buildings

    In satellite images, they are very pronounced with their blue coating. They may also heat up in the summer.

    Most of them are factory buildings, has been reported. You can see them added in and around camp facilities, whether they are low or high security premises.

    We can quantify them by counting them or via quantifying the space they take up. ASPIT decided to count them, though some buildings are smaller and other are massive. Google Earth has a polygon area measuring tool. A third option is to write a statistical model to calculate square meters factory floor space. If you are lazy you can consult a service that helps you with that via a visual detection algorithm — it calculates the area and records the number of blue roof buildings for a given satellite image.

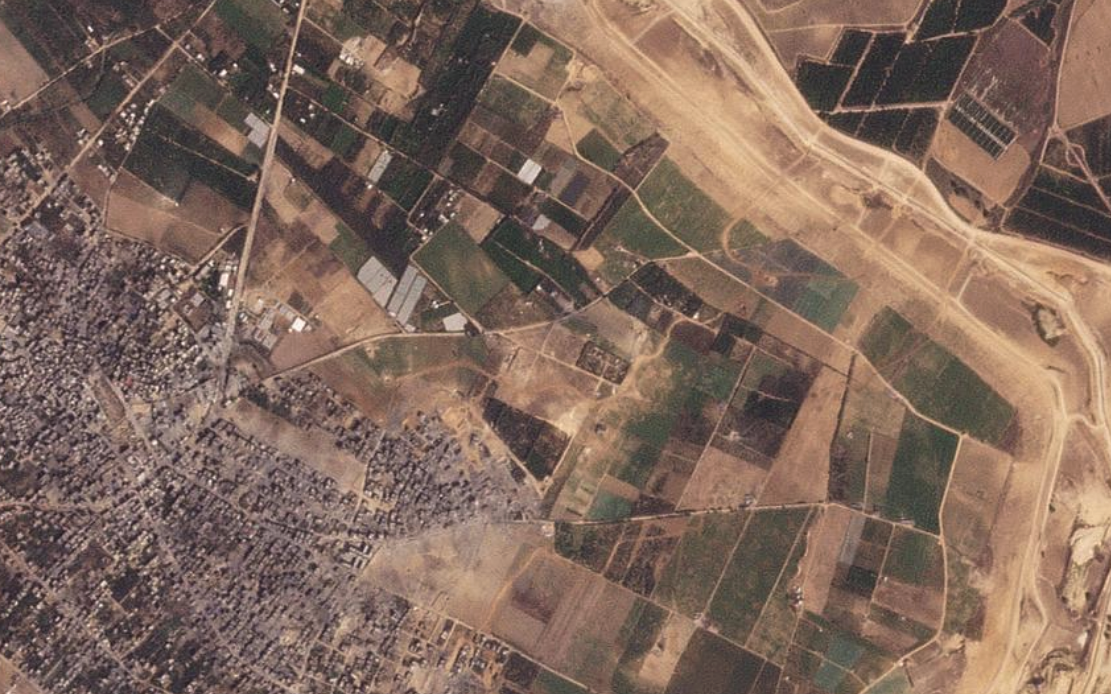
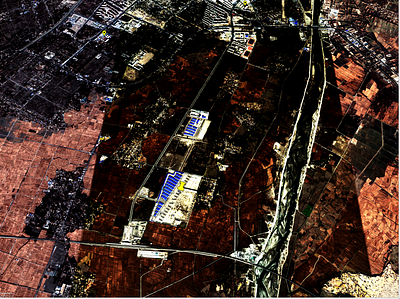
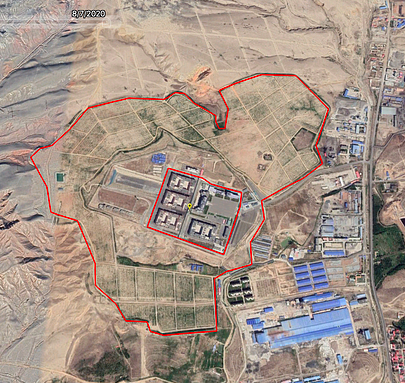
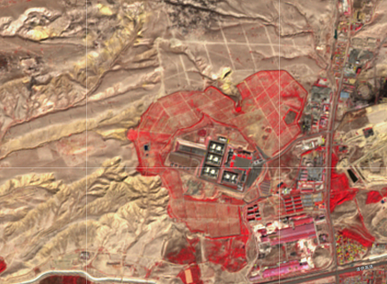
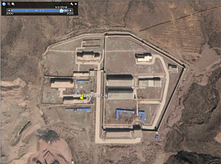
    One of the camps that expanded in the past two years is the tier 1 low-security re-education facility in Bugur in Bayingolu (41.808855284.3005783). It has a dense network of factory buildings nearby (around 23) and within its own walls there are eight. We used ASPI’s data to confirm this that noted: ‘considerable room for expansion’.

    Let’s run the classification system over it and classify how much blue-roofed buildings that scatter around the camp can we count (importantly not all are factory spaces but many will be).

    On the AI model: I downloaded the images with their highest resolution from Google Earth. To make the image a bit clearer for the model, I adjusted the brightness, upped the contrast and tinkered with the exposure. We can see the blue buildings, roughly in a radius of 1.5 to 2 miles (see image), account for about 1,464.9 m² (0.15ha). The number of little blue buildings expanded considerably since 2014 where they accounted for 1,022m2 (0.10 ha) — sadly we only have an image for 2014 and one for 2019.

    Short intersection on the availability of images available in Google Earth:

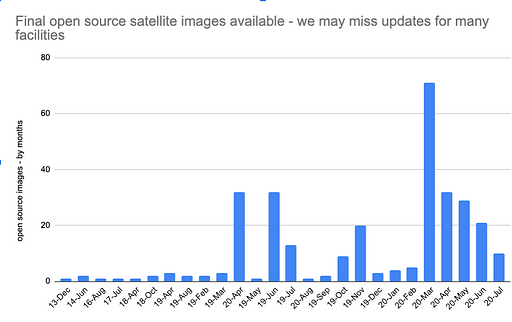
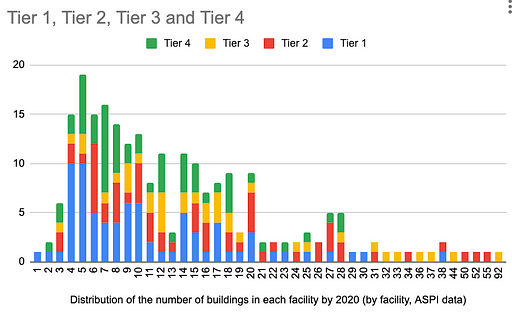
    Some of the important images to document the progression of these camps are missing. Some camps have a mere handful of publically available images (as in the case above). This is appalling and private satellite image companies need to be nudged to make more images public. Especially for the latest developments, this is urgently needed. Researchers noted down the latest dates for which images are available at the time of writing. Below we see them grouped by months, and then by facility category (tier 1 to 4).

    What about bias to provide fewer updates on higher-security facilities? We don’t have much to go in here (there is no direct evidence that western satellite companies are being pressured into not publishing their images for camps on Google). Despite only a few camps that didn’t get updated at all over the past two years, we can see at the time of writing that Google and others hold more images for lower tier facilities (1 and 2) than for higher-security facilities (tier 3 and 4):

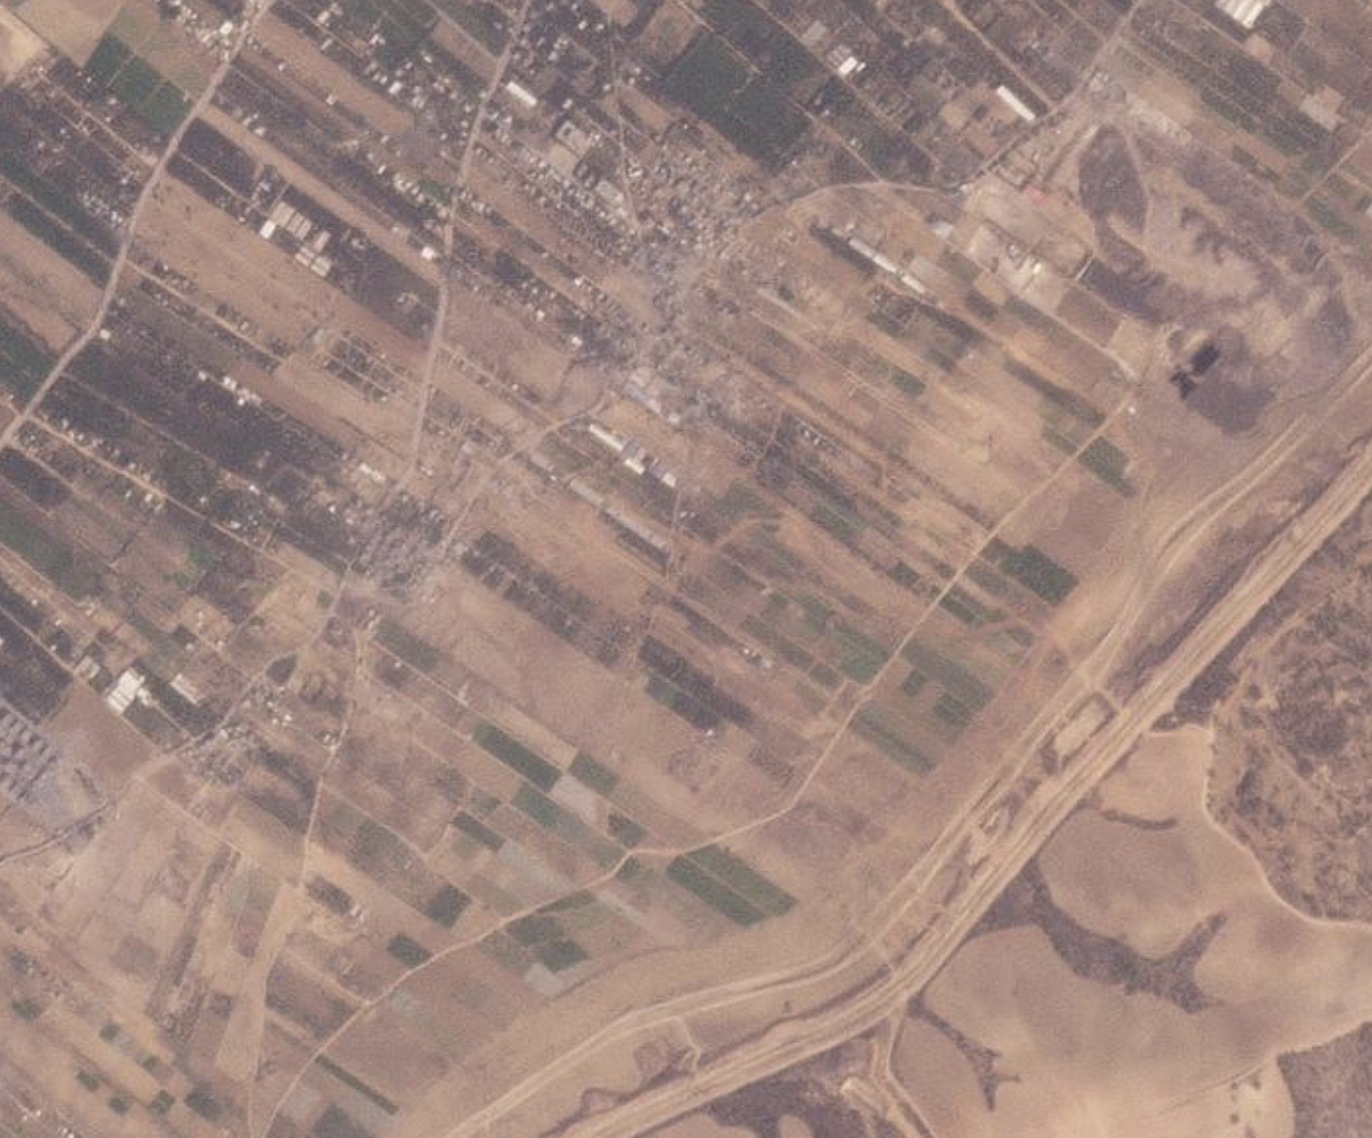
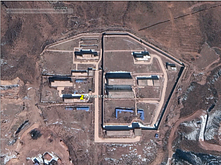
    Continuing on the factories, another example is the facility in Maralbeshi County (39°49’7.84"N, 78°31’4.37"E). It was erected around 2017/2018. In Google Earth, you can see how the blue-roofed buildings surround the internment complex. Note, how the larger blue factory complexes to the left and right were there before the camp was erected.

    In other words, the camp was planned and embedded into existing factory operation. It further corroborates a thesis that factory work by prisoners (in the form of forced labour), was part of a grander plan all along (though, to be certain, looking at satellite images alone does not suffice).

    Adrain Zenz thinks blue roof factories is something that warrants looking into in more detail. A bunch of these blue roof factory building were erected in 2018, especially in the second half. Zenz explains it’s important timing because the policy documents on forced labour, as explained in his post from last December, shows that a lot of this kind of policy was released in the first half or mid of 2018.

    A recent Buzzfeed investigation did mention blue roofs but surprisingly didn’t pay more attention to the matter. The factories grow in importance as the forced labour of imprisoned groups is being increasingly ‘commercialised’.

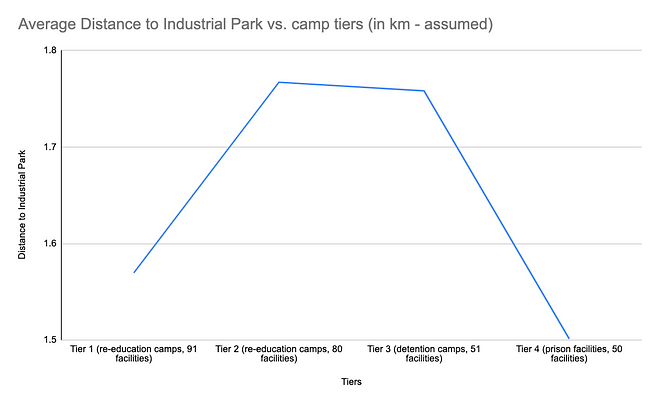
    ASPI’s data recorded the distance (measured in km I assume) between the 380 facilitates and the local/nearest industrial parks — where some of the forced labour could have moved to put to work. The data categorizes facilities in four areas of security (ranging from Tier 1= re-education camp to Tier 4= prison facility). Tear two and tier three camps tend to be located more closely to the industrial centre of the towns, the data suggests (see chart below):

    Zenz adds: “what’s significant is the sudden increase of blue roof, single story, flat type factory buildings. It’s consistent with policy, and also release, the Karakax list also talks about people being released into forced labour. A lot of that took place in 2019.”

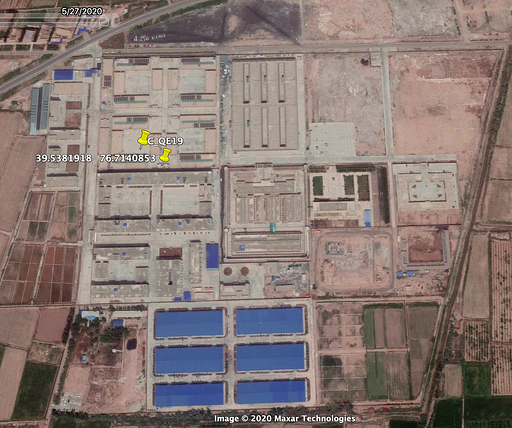
    The blue metal barracks found in Dabancheng shining light yellow in the sentinel IR images as they are being reflected. Low res Sentinel 2 data also suggests that these metal-like structures in the south of the Payzawat camp (Payzawat County, 39.538372, 76.713606) may also heat up in the summer. SWIR (short-wave infrared imagery) and NIR can be used for heat monitoring.

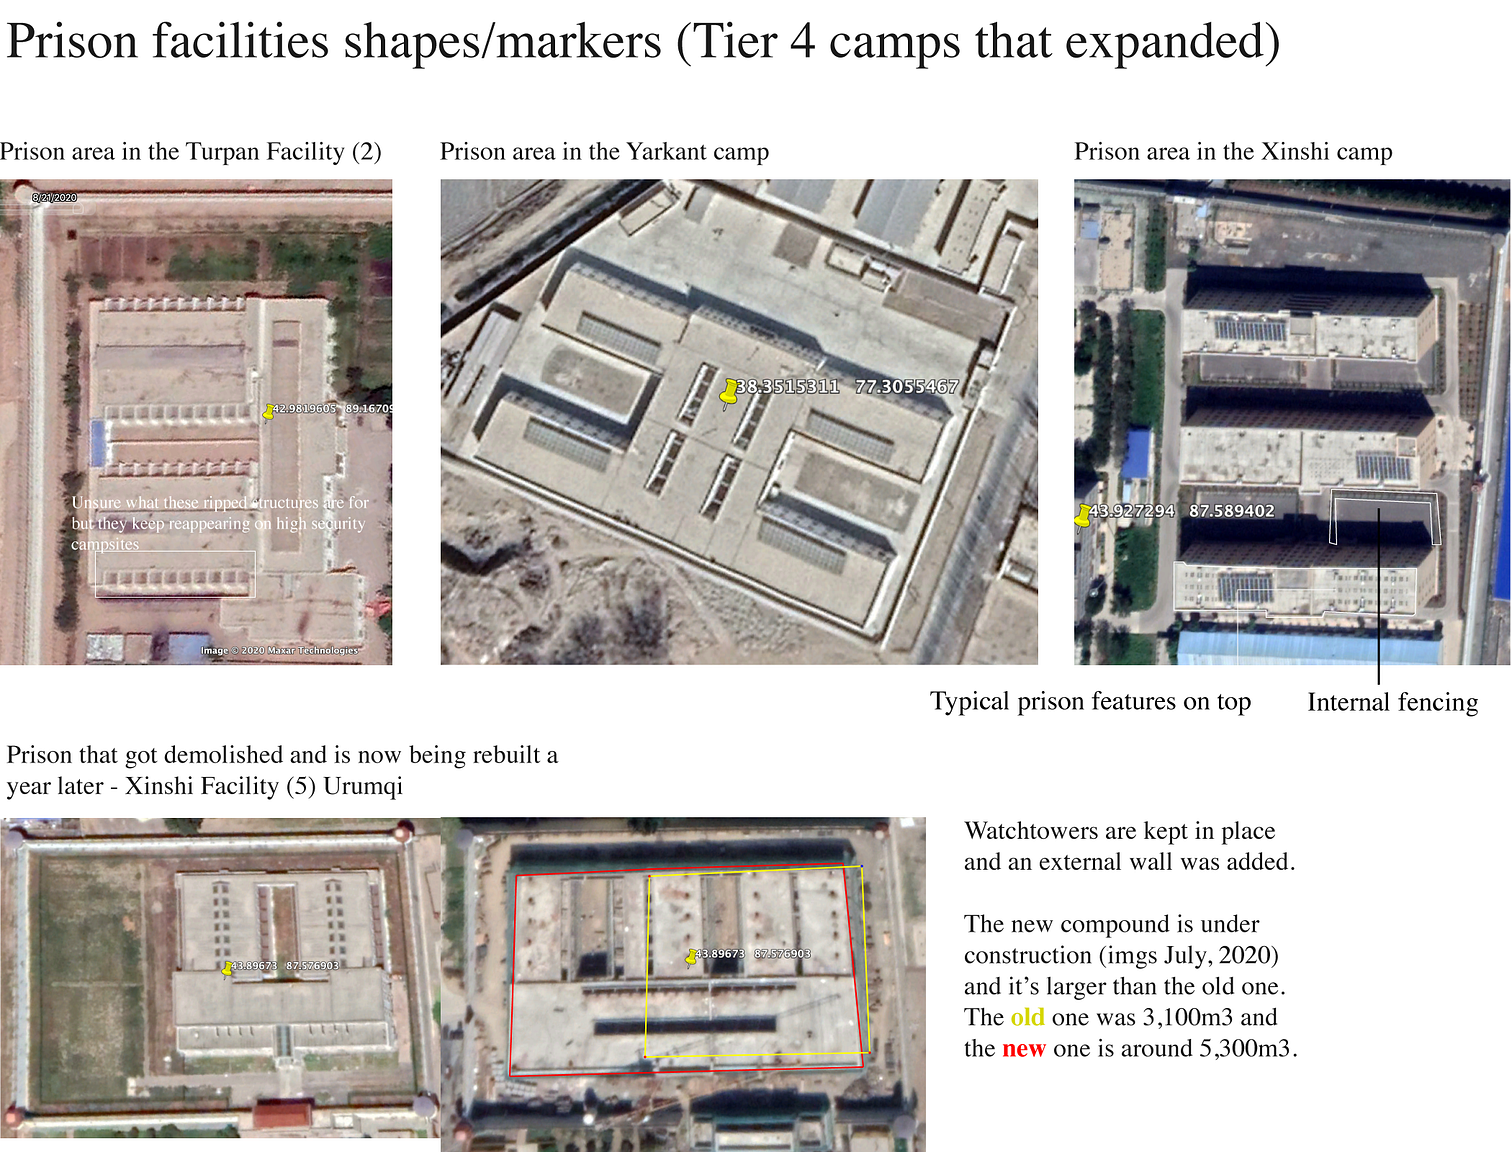
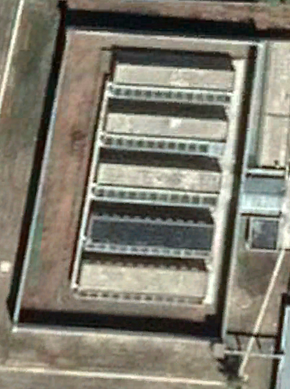
    Prisons features: camps that imprisoned people become more ‘secure’ not less:

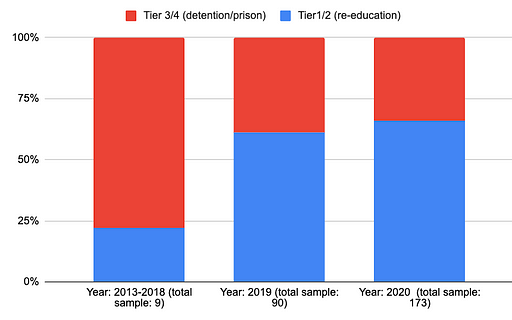
    Among the around 60 camps that have expanded recently, half of it are tier 3 or tier 4 facilities —detention centers and prisons with high security features.

    While it is true that some camps removed some of the towers and other security features (labelled ‘desecuritisation’ by ASPI’s records), others increased theirs. Those happened to be facilities that are detention centres and prison. In the context that Chinese authorities moved prisoners to these more secure facilities with less transparency and harsher treatments, this is cause for concern.

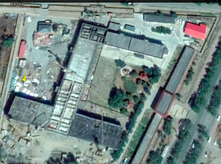
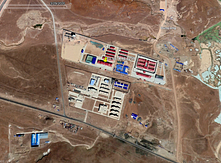
    Let’s look at an example. From the list of expanded camps, there is the camps Yarkant Facility in the Kashgar prefecture (38.351531177.3055467). Since 2018, we saw a nearly 10,000 m2 large factory compound built (compare images from 5/8/2018 with 1/21/2018). Then, a year later, watch downers got added. There are now 8 towners. For such a small facility that’s quite conspicuous. The reason it’s a high-security prison facility.

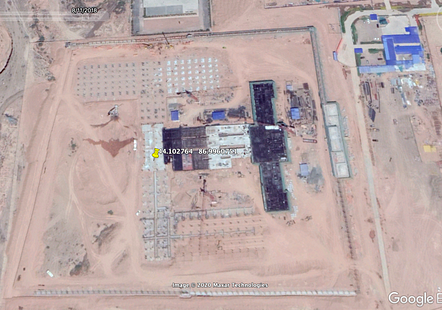
    Newly built detention/prison facilities created between 2018 and 2020 are of special interest. Camps like the tier 3 (detention) camp of Sanji Facility (#3, 44.102764,86.9960751), a with several watchtowers and an external wall is important as we can follow the progression of each step of the building process with high-resolution images.

    The location was probably chosen because of a lower-security area nearby, north of the facility (3/7/2018). Building must have started in the summer. A couple of months after the last shot (8/11/2018) the blue-roofed factory gets built-in the north-west of the camp (a reason to assume a direct relationship there) and within two weeks in August the main building takes shape. At the same time, the walls get erected and we can make out the layout of the facility with its heavy concrete structures.

    We can see, those are fundamentally different from building built in other lower-security camps. Then two months later it’s almost completed.

    The speed of building is noteworthy (better trackable if we had access to a more continuous stream of images). From the few images we have above and those from Sentinel 2, below, we can assume that it took the developers between three to four months in pure building time to pull it up — an astonishing pace. China is renowned for its fast building pace. For many other areas, such as coal plants and artificial island-building its cookie-cutter approach — where blueprints are being re-used over and over again - it permits building more quickly.

    Other who looked at the situation in Xinjiang reported that many Uighurs held in lower-tier facilities could have been moved/transferred to higher-tier prisons. In other words, despite some re-education camps have experienced ‘de-securitisation’, half of the camps that expanded are higher security facilities, so tier 3 (detention) or tier 4 (prison) camp facilities.

    What parking lots tell us about the camps during Covid-19

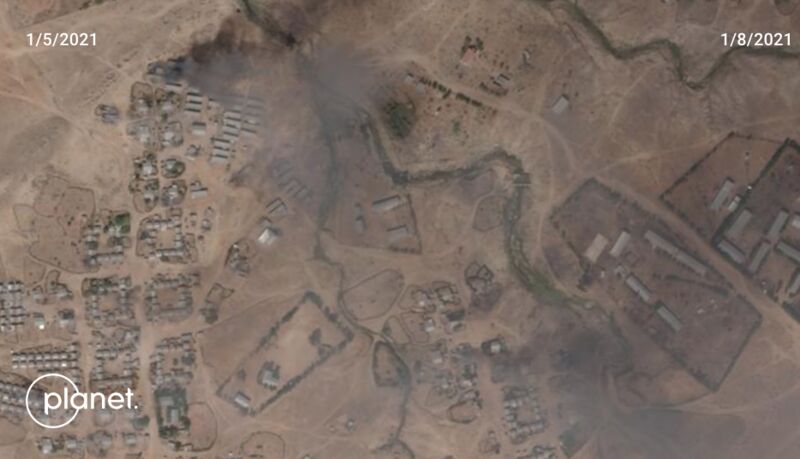
    I believe this topic has largely remained unexplored. Busy parking lots are one way to tell how many staff members are on site. Especially interesting it this for the recent month that were affected by coronavirus. We dont know much about the conditions inside of the facilities.

    But with fewer staff members around (and fewer visitors allowed — previous reporting has revealed that detention centres have ‘small visitor centres’), the lives of inmates may have worsened. There was some reporting that Covid-19 cases spiralled in the province of Xinjiang and some expressed concern that cases could spread within camps. It’s possible, no doubt. With only a few cases in the whole region, though, the risk is lower.

    Pandemic related fears may have affected the material and food supply. Sick imprisoned detainees may go without healthcare treatment for weeks or months. All these are assumptions for which we have little evidence. But the possibility alone raises concerns. If it is true that prisoners remained in the facilities during Covid, they could have suffered from the absence of staff and proper care.

    From satellite images, it is hard to know — though there is some evidence from an eyewitness account shared by a historian, a Georgetown professor on his Medium page.

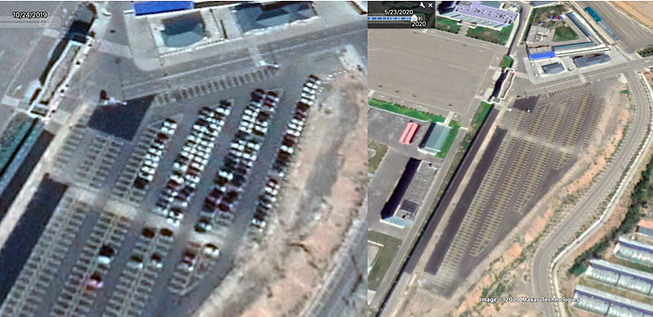
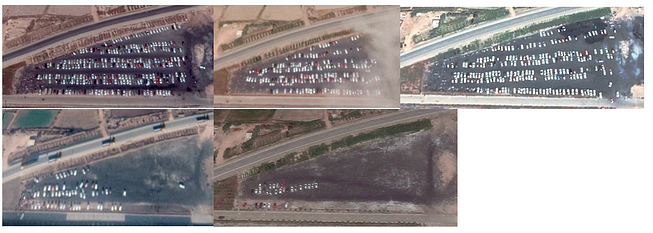
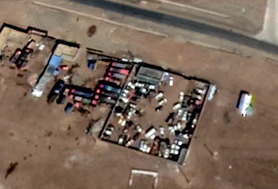
    We might be able to tell how many temporary people were on sites (those that use their car to leave for the night). Counting vehicles at nearby car parks is one way.

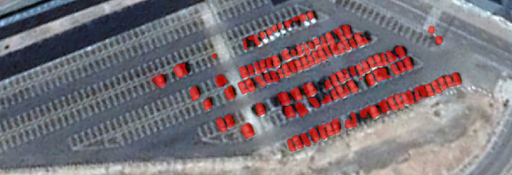
    At some facilities, we can clearly see the parking lot. An example is Ghulja City (43°58’37.52"N, 81° 8’18.98"E). It’s a fairly large car park. We can use Picterra system (there is a 10 day free trial version) to check the satellite images for May 23 — thought there isn’t much to count, the car park is empty.

    Seven months earlier, on October 24th of 2019, we count around 120 cars (with some false positives, but that’s good enough for us). The algo gives you a count so you don’t have to count the red boxes one by one. Once trained, we can run it on subsequent images.

    Let’s walk you through how to train and count the cars. I simplify here (a more complete tutorial can be found here and in their platform). First, we use one of the images to train the algorithm on the cars in the car park. Then we run it on the other pictures. It’s neat and simple (and quick if you don’t have time to run your own statistical model in python).

    The number of vehicles dropped during the heights of Covid-19.

    We could do this for other confirmed location such as the facility in Chochek City (Tǎchéng Shì, 46°43’3.79"N, 82°57’15.23"E) where car numbers dropped in April. We see this in many other facilities (for those that expanded).

    Hotan City Facility #1 (37.1117019, 79.9711546) with 81 cars in the parking lot at the end of 2019 dropped to 10 during the height of the pandemic. Similar developments have been perceived at Hotan County Facility 1 (37.2420734 79.8595074), Ghulja Facility 1 (43.9756437 81.5009539) and a number of others.
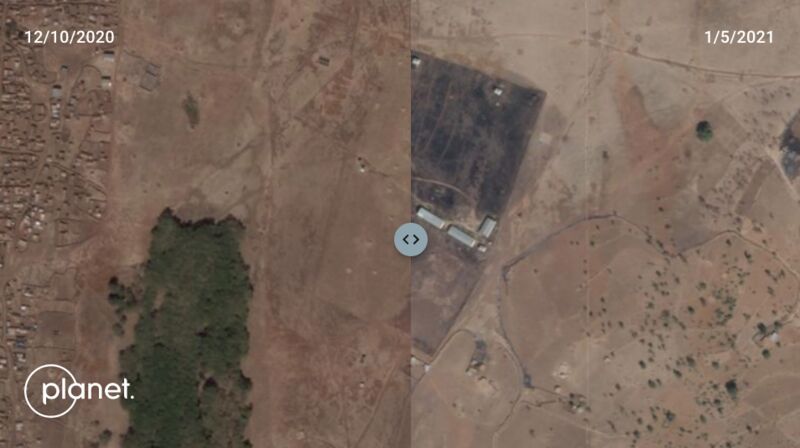
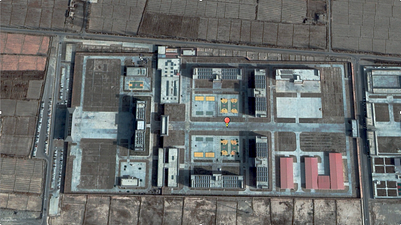
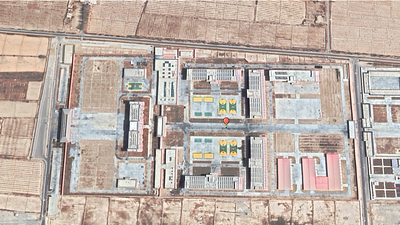
    Calculating rooms and capacity

    How many people fit in a facility. If we take the example of the re-education camp in Chochek City ( 46°43’3.79"N, 82°57’15.23"E), we have high res Google images for the end of March and end of April of 2020. We can see the thin middle part is three stories high and in earlier images (Jul 18, 19) we can see the southern part is four stories high. In 2018, we got an image of the foundation when it was built. This provides enough detail to calculate that the facility has around 367 rooms — for the total t-shaped building with the arms.

    –—

    –—

    In the example above, we shouldn’t be too sure that alls detainees were kept in the facility during Covid. Some reports claim that some of the other lower security re-education centres kept people ‘only during the day for indoctrination classes’ (it’s certainly different for the high-security prison facility that is also on the premise of the Payzawat facility, see in the south, with their towers).

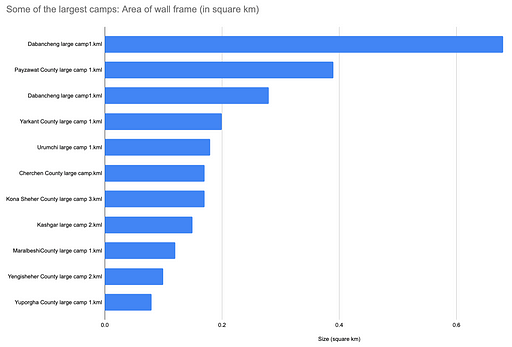
    Comparing camp sizes

    The total size of the camps matters, especially when they get extended. Most of the camps have clear wall frames build around them. It’s one of the most important and simple characteristics. The wall frames makes it relatively easy to draw shapes in your geolocation system of choice (the sheer size of the walls, might be less ideal to gauge the number of prisoners).

    Some have vast empty space in between might suggest that other faculty sections or factory buildings are due to be added. Some are cramped with building.

    Tracing and calculating the area of wall frames in Google Earth for some of the largest camps, we get what we already knew:

    To emulate the work ASPI’s data was posted here. A number of track and trace tutorials for Google Earth (one here on measuring property space) are available on YouTube.
    Staking out camp size:

    The Qariqash County/قاراقاش ناھىيىسى‎ /墨玉县(Mòyù Xiàn, 37° 6’44.88"N, 79°38’32.71"E) sits in the South of the large stretch of desert.

    We use the polygon tool in Google Earth to stake out the clearly marked walls. You usually end up with a rectangle. Under measurements (right-click on the item) you can see the perimeter is around 1.65 km and the area is roughly 16.7 hectares (0.17 square km).

    Now we can compare it with another one on the list, the camp in Aqsu City (41°11’27.12"N, 80°16’25.08"E). It’s markedly smaller, with a perimeter of 1.1km and only an area of 5.65 hectares. There are other ways to do this in QGIS, a geoinformation system more efficiently.
    What can walls and towers tell us?

    How tall are walls at some of the camps? The answer varies across the vast variety of facilities. Height may tell us something about who built the camp and the level of security. It’s unsurprising to find different heights at different camps built by different planners.

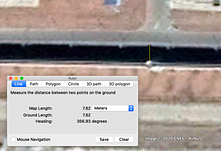
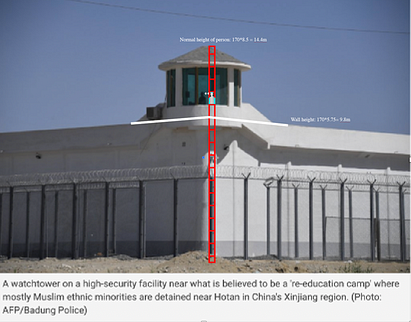
    Where we don’t have shades available, we can check the two images above and reference them with the people in the image and define the height this way. Another standard way to calculate height is using the shades by the walls and towers and calculate the height via Google Earth and SunCalc.

    The shade of the southern wall in the satellite image from 03/19/2020 for the Dabancheng camp is around 7.62 meters long. The towers on the southern wall for those dates result in a height of around ~8meters.

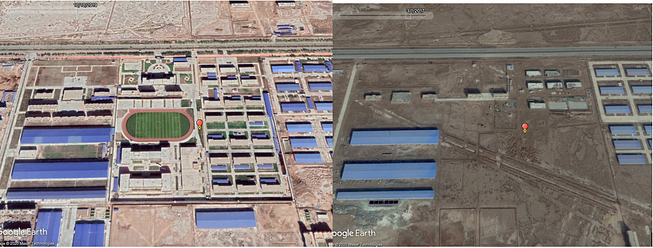
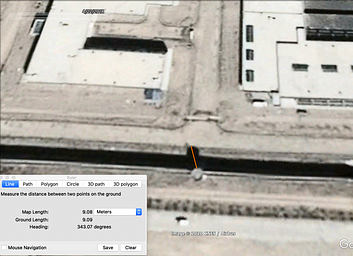
    But the images in the Reuters shots look different. That’s why they were taken a year or two earlier. Satellite images from 4/22/2018 show clearly the octagonal shapes of the tower shades. If we calculate again, the shade of the tower is around 9 meters long, translating into around 14 meters in height.

    We do this for the wall as well. What we find is that, although the towers disappeared (though, some are still there, just not protruding so visibly), the only thing that really changed is the height of the walls — now around 13.5m tall, compared with 9.5m in 2018. The same towners, removed from one Dabancheng camp, then re-emerged half a kilometre south-east at the other newly built one (2019).

    Why are we even bothering measuring height? On one hand we want to answer how security changed across the camps. Are walls getting higher? Do they change in their layout. It helps to classify the type of camps. The higher the walls, the more secure they probably were meant to be. Higher wall might mean higher chance that prisoners are held at facilities over night. It also may help to disprove claims by XJ denialists.

    We can verify the Suncalc analysis with images. Cherchen County, for which we reviewed images for 12/14/19 shows roughly the same height. Explainer how to measure the height of an object from satellite image available here and here.

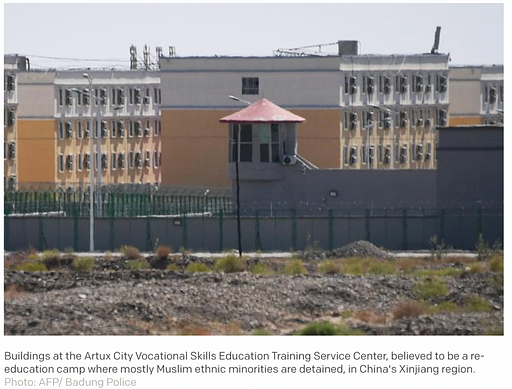
    The number of press images of the camps is limited. Most are by Reuters or AFP/Badung Police. It is this one here (37°14’29.78"N, 79°51’35.00"E). More local street footage, though not of camps, might be obtainable via Mapillary.

    Buildings shapes/outlines and location of camps

    Let’s start with the location of the facilities first. ASPI recorded the type of security for its 380 odd facilities, and for many the distance to populated areas such as residential buildings. When local administration planned on where to place the facilities they might have taken into account how the neighbouring public should (or shouldn’t) perceived them. More secluded camps are more hidden from public scrutiny. Those near people’s homes or schools may be placed there to have the opposite effect.

    What’s immediately apparent when running a few inferential statistics on the records is that the more secure detention centres tend to be kept further away from buzzing residential areas — meaning, further away than for instance Tier 1 re-education camps, which are often nestled between residential parts of cities, or occupying old schools.

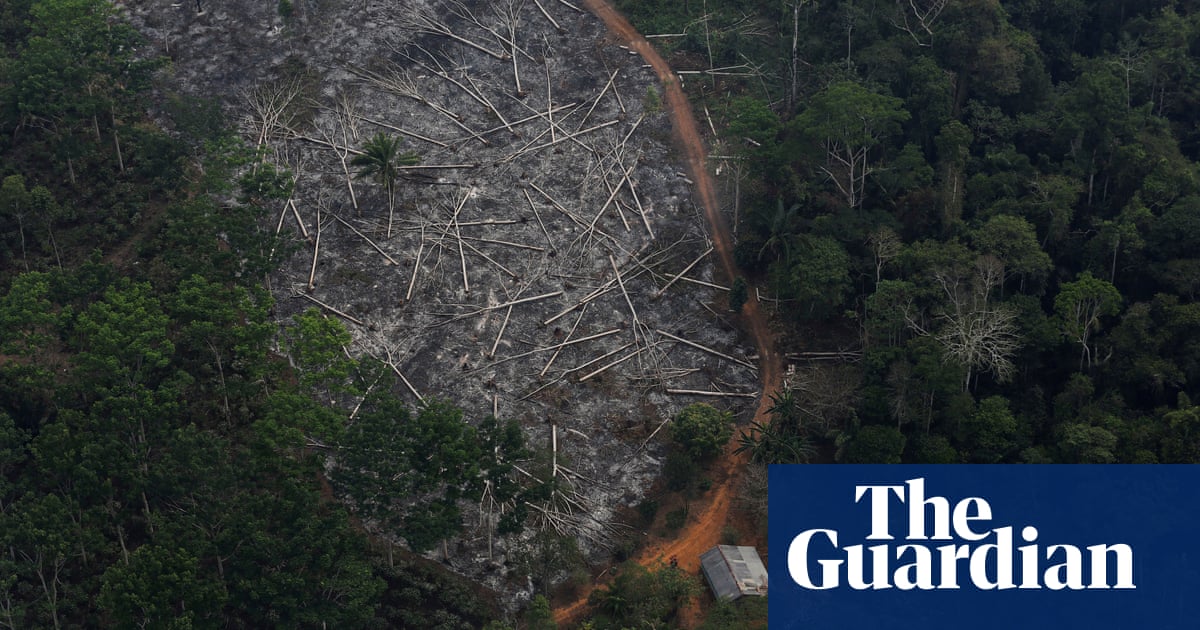
    Agriculture/fields around the camps — investigating forced labour by detainees

    Identifying agricultural fields near or around facilities may reveal some potential aspects of how forced labour in the camps were used in close vicinity.

    Especially for secluded faculties, with not much else urban life going on (so reducing the possibility that other local farmers were involved in working the them), the chance increases that Uighurs detained were used.

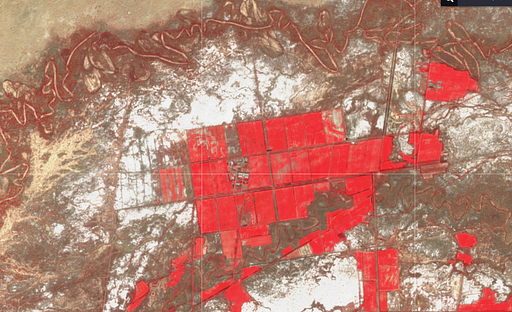
    One example is the facility near Yingye’ercun, in Gulja, with a 0.16km2 large campground (43°58’37.52"N, 81° 8’18.98"E). The farming area that was developed since 2018 (shortly after the multistorey buildings was built in the core of the facility) spans 1.7km2 and is clearly marked (which includes the facility itself, see in red below).

    In other words, once the camp was built the fields surrounding it got worked and developed— unlikely to be only a convenient coincident. The nearby factory complex was also extended.

    Often it warrant also checking with Sentinel 2 images on EO browser. In this case, it’s useful because it allows us to visualise agricultural development via its invisible light remote sensing capabilities. Additional bands (which Google images lack) give access to the invisible spectrum and shows the agricultural expansion (here shown in red via the false colour composite, commonly used to assess plant density and health, “since plants reflect near-infrared and green light, while they absorb red”. Exposed ground are grey or tan, vegetation is red).
    Image for post

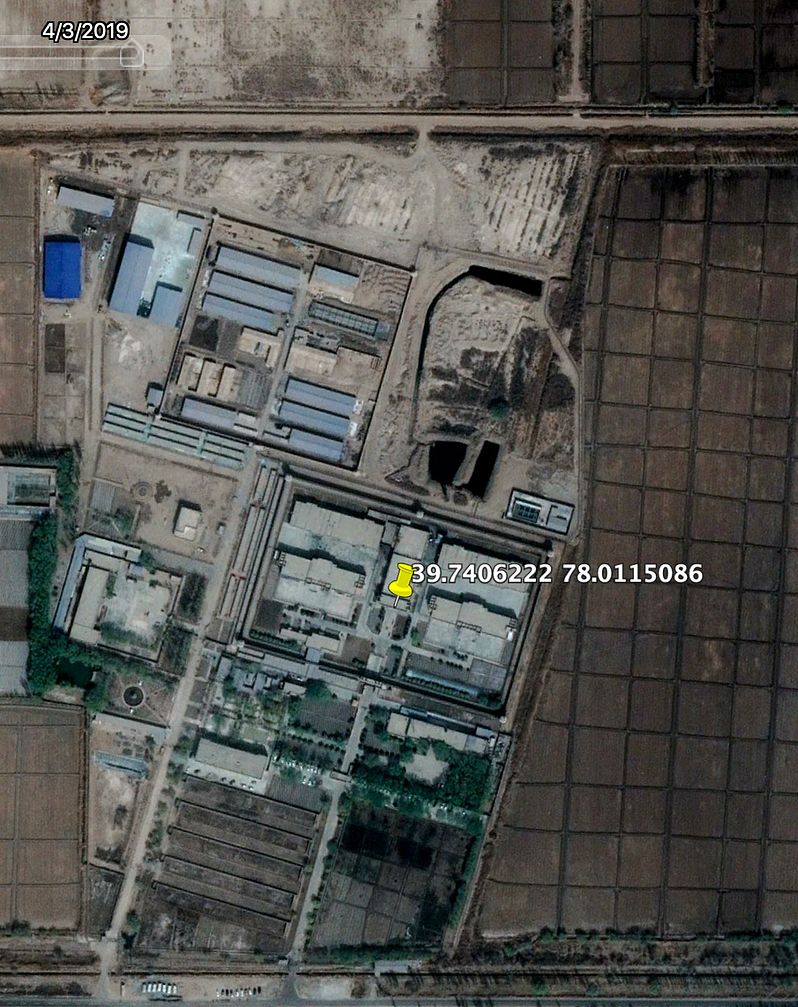
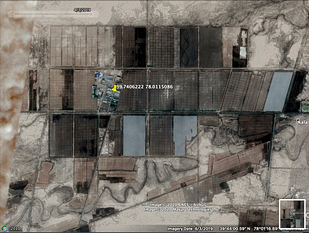
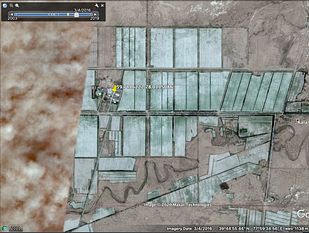
    Another camp in this regard is the Maralbeshi Facility (#6) in Kashgar (39.7406222 78.0115086) with lots of fields surrounding it.

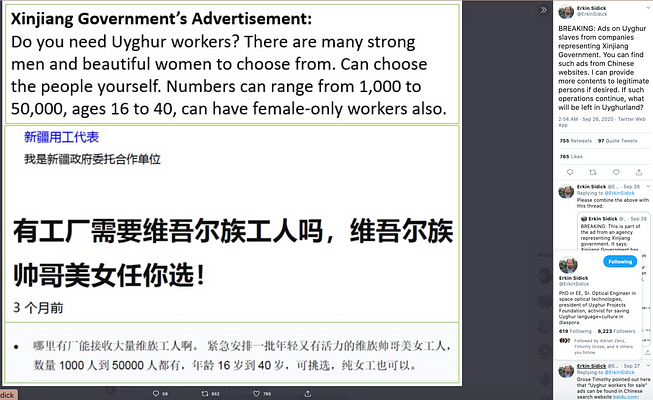
    Why is the forced labour aspect in Xinjiang’s agriculture so important in this debate? For one, it’s part of the human rights abuse that more and more governments and industry leaders recognise (such as Swedish company H&M, who profited from cotton supplies and other kinds within their supply chain). Some decided to cut ties with suppliers in the region. It may the answer for the short term. In the long run, western businesses much apply pressure to get suppliers on their own to dissuade local forced labour practices (see example on ads that emerged to sell Uighur forced labour online).

    According to the ILO Forced Labour Convention from 1930, forced or compulsory labour is defined as ‘all work or service which is exacted from any person under the threat of a penalty and for which the person has not offered himself or herself voluntarily’.
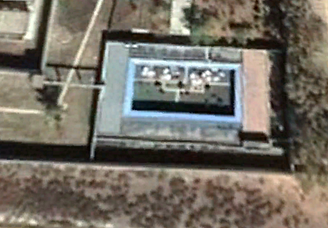
    Sports grounds: (basketball and other sports courts)

    Some found value in observing their development. BBC’s John Sudworth found that just before a press tour organised for his press teams two years ago the appearance of recreational areas altered. In some of the places they were taken to, satellite images and the internal security fencing — and what looked like watchtowers- where taken down shortly before the tours for journalists began. Specifically on sports grounds, they noticed that empty exercise yards have been transformed into sports facilities.

    The reporters asked: if the journalists have been presented with mere ‘show camps’, what may this say about the places they were not taken to. Sport facilities are quite easy to spot from satellite. The BBC travelled to Kaxgar in the very east of the region, about 100km south of Kazakhstan’s border. Their footages shows how the camp put up courts shortly before the press trip. But they didn’t last long. We found evidence that these very courts disappeared again in early 2020 (see below).

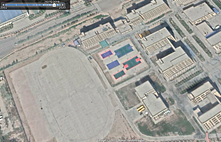
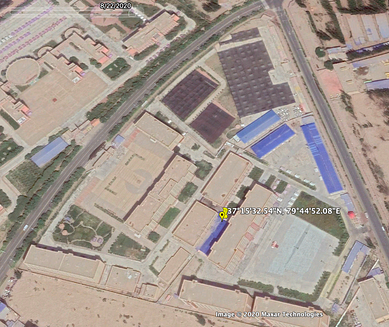
    In one of the camps in Qariqash (37°15’32.54"N, 79°44’52.08"E) the sports facilities were made unavailable as recently as July. Now big brown sheets, what looks like blankets with knobs on them, cover them. Those have never appeared on satellite images before and extend to the soccer field in the north and the big parking lot next to the sports courts.

    I have mixed feelings about recreational activities. We must strongly doubt that they benefit people held for indoctrination. So are they only a smoke and mirror game to show the friendliness of re-educational camps? Or are they actually benefiting the imprisoned? It is hard to say. In recent time, they are more likely to be added than removed. In around 37 facilities on the ASPI list basketball courts, running tracks or other sports fields were noted to have been added or extended.

    When we compare the average distance of residential building for these places (1.2km) with the average distance of all the places where we have a record on the distance to buildings (1.8km), we find the recreational activities might be used as an element to signal the locals that the facilities have those recreational features.

    Dabancheng has one court in the western block and a number of other ones in the centre part. In the eastern wing, there is nothing. We haven’t got any further high res satellite images on Dabancheng (other than those until March 2020, that leaves only checking Sentinel 2 images or commercial images).

    I am going to stop here. The analysis of recreational areas yielded rather little, for me and the folks at ASPI. “I don’t think the sports grounds mean much in the detention regime”, Nathan Ruser says. If you have more info do reach out or leave a comment.
    Crematories

    The New York Times followed the lead of findings (that emerged last year, also mentioned in the state.gov report) and check the extent of description of religious sites and burial grounds. In September, the team reported that ‘thousands of religious sites’, such as mosques, shrines and other sites were bulldozed or replaced.

    As many burial grounds disappeared and people within camps families have never heard from again, the question of how Uighurs’ life proceeded became more pressing. Crematories may be one aspect. Some anecdotal evidence by a source spoke of a nascent growth of crematory sites in the areas near camps. This appears important in the context of how prisoners are treated in facilities and what happens if they die and at what rates.

    High prevalence of tuberculosis in facilities worries insiders. TB is spread via droplets through the air by someone who is infected. It’s especially deadly when the immune system of those who caught it, can’t cope with it. With the conditions reported by some of the eyewitnesses, it is feasible that the hard conditions prisoners are being subjected to, could enhance the deadliness of TB.

    The think tank which produced a previous list of facilities searched and found a handful of crematories (I don’t think they concluded the research and it continues, perhaps with your help of OSINT research).

    The reason why crematories are of interest is that Uighur are Muslim, Muslims don’t burn the bodies of their dead. They bury them (creation is strictly forbidden). Seeing more crematories pop up might be a first clue on whether dead bodies from detention facilities are being burned. We have to stress here, we have to be extremely careful with drawing quick conclusions, the base of evidence is thin. One would need to check local statistics and cross-examine them with other data source.

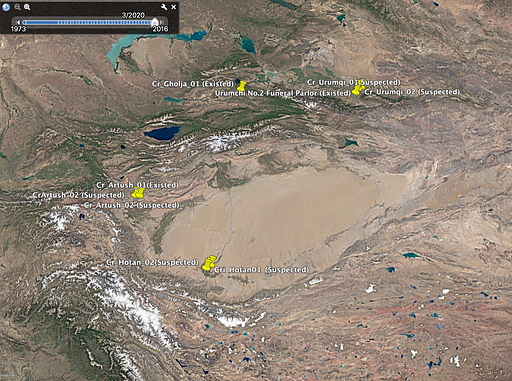
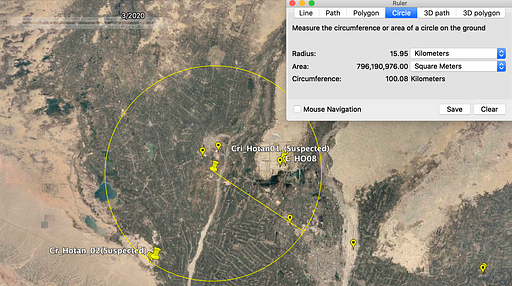
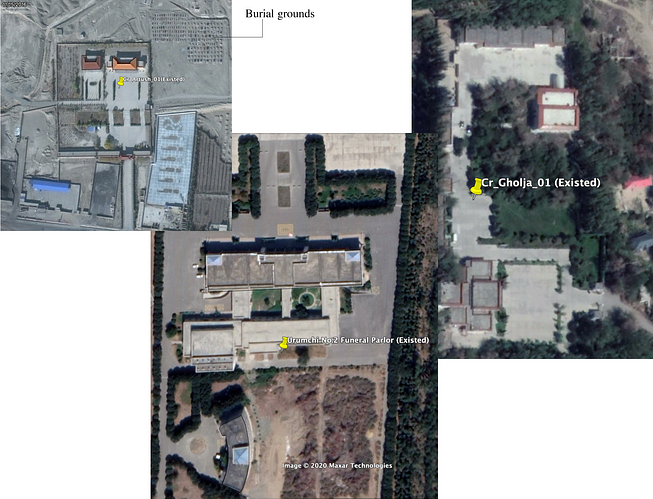
    We will concentrate only on the sites itself. The ‘unconfirmed sample of crematory’ consists of ten sites. These are listed below. Just a word of warning. Feel free to investigate them further — either via additional satellite footage or on-site visits. Nonetheless, these get us started. The first three are confirmed by eyewitness accounts or local records (as far as I was told, this is sadly only secondary research).

    Cr_Gholja_01 (Existed, 44° 0’17.86"N, 81°13’40.43"E); Cr_Artush_01(Existed, 39°44’35.47"N, 76°12’7.49"E); Urumchi 2 Funeral Parlor (Existed, 43°54’55.20"N; 87°36’9.01"E)

    Cri_Hotan01_(Suspected)
    Cr_Artush_02 (Suspected)
    Cr_Hotan_02(Suspected)
    Cr_Urumqi_02 (Suspected)
    Cr_Urumqi_01 (Suspected)
    Cr_Urumqi_01(Suspected)
    CrArtush_02 (Suspected)

    Now let’s take a look at the characteristics of the confirmed crematories. They have some distinctive shapes, including a rectangular architecture, walls or a treeline that fence the premises (framed in black). Where marked ‘burial grounds’, I was unable to confirm this but checked with a few other sites mentioned in the coverage that was exposed in 2019 and it looked similar (in short, more time needs to be spent on this).

    What helped the researchers identify the confirmed ones? According to the source, the Chinese called them ‘burial management facilities’. It’s apparently a euphuism for ‘crematories’. The Chinese government bulldozed some burial grounds with the justification that they would take up too much space which was covered in the 2019 reporting.

    The other aspect is whether relatives receive the body of loved ones that die in the camps. Salih Hudayar (now Prime Minister of the East Turkistan Government-in-Exile) says he had a relative who died in a facility (he don’t know whether in the camps or the prison) and his family was not able to have his body returned. He thinks that many other Uighurs have not had the body of a deceased family members returned to them. He assumes they are being cremated as no record exists of a burial site.

    More crematories are only possible if you have employees who staff and run them. The Chinese government tried to find those employees online. “We assume they are being cremated because the government ran job ads and offering high salaries to work on these [crematory] sites”, he added.

    The suspected crematory facilities were then modelled upon the layout of the existing/confirmed ones — e.g. compared with buildings in and around the area. “We found a couple, but we are not 100% sure”, the source admits. Here OSINT journalists could become useful (let me know if you have intel on this matter to follow up with).

    On the description in 2019: evidence surfaced that 45 Uighur cemeteries have been destroyed since 2014, including 30 in just the past two years (research was carried out by AFP and satellite imagery by Earthrise Alliance, here reported by the SCMP).
    What population/urbanisation numbers tell us about internment

    Salih Hudayar explained that what worries him is that population statistics don’t square. An often-cited figure of 7 million Uighurs in the province is much lower than the official estimates of the Uighur people.

    The number often used is 12 million Turkic-speaking Muslim Uighurs. The number could be higher. Especially in the villages — Uighurs are allowed to have only three kids — some families have more than that and don’t register their offspring, as a result, many kids lack birth certificates. Other figures on the number of Uighur population is much taller (larger than twice of the 12 million figure, but remains hard to confirm that. The closes figure the Chinese government will have internally after the government’s extensive and invasive security and surveillance campaigns, in part to gain information regarding individuals’ religious adherence and practices).

    The rising number of orphanages and kindergartens is also of interest. A satellite and local administrative data analysis should track them. The premise here: the more aggressive the detention of families are in XJ (moving Uighurs from low to higher security facilities), demand for places that house children increases. More orphanages and child-caring facilities could be revealed.
    What can exports tell us about forced labour?

    The type of exports of a region can help to figures out what to look for when it comes to forced labour. Increasingly, the international textile and fashion industry wakes up to reputational damage if supply chains incorporate Xinjiang forced labour. EU leaders held a meeting with China’s president Xi last week where Xi ‘rejected’ foreign [political] meddling in his nation’s affairs. But businesses have more leverage. Xinjiang is busy trading with foreign powers. The Chinese province accounted for a large part of the world’s supply in cotton. Exports amounted to $19.3bn according to export documents (export data for the west of China can be found in China’s official data stats, Stats.gov.cn, customs.gov.cn, or mofcom — this might be useful. Comparing what the government reports and what’s happening on the ground might reveal discrepancies, as it did before).

    Exports (to Europe, across the silk road to the west) is directly connected at A busy train station connecting to the neighbouring country of Kazakstan in the northeast (the export route is called Ala Pass. A short promotional video here). Given the rebound of the Chinese economy, the shipments/trainloads must have increased in May after the effects of the pandemic subsided. What’s unclear is to what extent and whether that matches what the government said.

    Satellite images might reveal discrepancies when train containers at the Dzungarian Gate (the Dzungarian Alatau mountain range along the border between Kazakhstan and the Xinjiang Uyghur Autonomous Region) are analysed. It’s the main connection between China and the west.

    The main railway station in Xinjiang for the Alataw pass is the Alashankou railway station (situated here: 45°10′13″N 82°34′13″E). It’s the last resort for export containers before entering Kazakhstan.

    OSINT journalists may be able to gauge Xinjiang export traffic by counting the number of containers on rail tracks. It might be laborious effort, not sure if it yields anything.

    More useful would it be to monitor the use of agriculture and factories in the nearby vicinity of camps, as shown before. Or perhaps they can be linked up.
    Baidu maps: Checking what the Chinese tech companies are ‘hiding’:

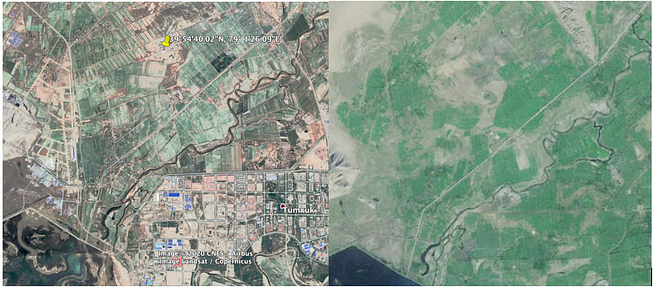
    The Chinese government may have little interest to showcase their human-rights violations which they deem as justified (Xi’s statement). Satellite images on Baidu Maps show maps that hide most of the facility. What to make of it? Google Earth lets you upload so-called ‘overlays’. If you stretch them to the right size you can compare the uploaded screenshot (we took from Baidu) with those present in Google Earth. For Tumshuq City/تۇمشۇق شەھىرى/图木舒克市(Túmùshūkè Shì) (39°54’40.02"N, 79° 1’26.09"E), see below.

    Why is Baidu’s involvement increasing relevant? On one hand, it is important to see the connection between private sector companies and the government. Chinese satellites are able to update and provide high-resolution images to the maps on Baidu. But they don’t. We had a similar debate on Twitter, that some government used to press companies to blur our images. But because images are available on other platforms ‘unblurred’, the practice was largely discontinued (there are still examples but they are getting fewer). One reason is that if a blurred area appears, it signals others to be extra vigilant and look out for other images. Instead, what increasing happens is that companies with private satellite are ordered not to release them (read more about the debate here).

    Baidu map’s decision to not show images on certain facilities have backfired. It can be reverse-engineered. Areas where images are unavailable became extra interesting. In this way Buzzfeed used Baidu Maps to their advantage. They located/confirmed some of the camps because of it. This way, they turned shortcoming into an opportunity. You may want to be quick in replicating this principle for other parts of the country where forced labour/detention camps are expected (e.g. Tibet). Such loopholes will usually be fixed swiftly.

    Bit more on the tech. According to a 2019 report by Human Rights Watch, Baidu’s map function used in the IJOP app, a controversial system used by the police and the state that generates “a massive dataset of personal information, and of police behaviour and movements in Xinjiang (it is not known how the authorities plan to use such data): The IJOP app logs the police officer’s GPS locations and other identifying information when they submit information to the IJOP app. The IJOP app uses a map functionality by Baidu, a major Chinese technology company, for purposes including planning the shortest route for police vehicle and officers on foot, according to the app’s source code.
    https://miro.medium.com/max/653/1*umOMbKghZDqPPiy0TpGZ7w.png

    What can the camps in Tibet tell us about the camps in Xinjiang?

    Reuters reported just last week that forced labour expanded to Tibet (south of XJ). Reuter’s own reporting corroborated the findings obtained by Adrian Zenz. It would take another post to go into how to investigate the state of transferred Tibetan labourers. The quick and dirty check on the situation shows the merit of using satellite images to investigate grows as foreign journalists are being barred from areas, such as entering the Tibet region (foreign citizens are only permitted on government-approved tours). OSINT lessons from investigating XJ should be applied to Tibet too.

    How does Xinjiang link to Tibet? The former Tibet Communist Party Secretary Chen Quanguo was chosen for the same job in Xinjiang in 2016 and headed the development of Xinjiang’s camp system, Reuters reported.

    Mass incarceration started before Quanguo came onto the scene: A fanghuiju work team was dispatched to a village in Guma wherein 38 individuals were allegedly detained in a government campaign, in early 2016 — it’s true however that Party Secretary Quanguo, appointed in August 2016, who waged a ‘Strike Hard Campaign’ against violent activities and terrorism increased repression.

    In an article last year, The Print used satellite images to prove that at least three Tibetan “re-education camps” are currently under construction. The author of the survey was Vinayak Bha, an ex-colonel retired from the Indian military intelligence unit.

    Col Vinayak Bhat (@rajfortyseven on Twitter) found three camps in 2018/2019 and share them. One of them is the one in Botuocun (see below). Bha writes about Chinese military deployment dynamics. The temple of Tibetan Buddhism is a ‘concentration camp’ that is surrounded by high walls and guard towers and has the same structural design as a prison. It is feasible that China’s mass detention to spread to Tibetans. Methods will likely base on the model executed in XJ.

    https://miro.medium.com/max/221/1*ln7TsCnetV75EKNcv4LBJg.png
    https://miro.medium.com/max/221/1*DtJKKnYJUH1K7p1_Pyyicw.png
    https://miro.medium.com/max/221/1*4dU7K9DK9agNbitNmLBT4g.png

    The reports of the three camps emerged in 2019. “Small-scale versions of similar military-style training initiatives have existed in the region for over a decade, but construction of new facilities increased sharply in 2016, and recent policy documents call for more investment in such sites”, one report stated. Looking at the three sites, some of them are quite old but the one below is less than three years old.

    https://miro.medium.com/max/221/1*xFr73HSkbxVqDGNgicuVCQ.png
    https://miro.medium.com/max/221/1*Ylxp6Hk1Nj8AAkvvxXI21Q.png
    https://miro.medium.com/max/278/1*a4UgMAeLCBp9LvRfOuf6Tw.png
    The allegation is that these facilities are now be used as detention centres for political indoctrination. “The detainees are allegedly used as forced labour in government factories and projects during the day time or as per shift timings”. It is something that rings true under the light of camps in Xinjiang but we lack evidence from the satellite images.

    There is some evidence that additional factory buildings were added. For the facility above, buildings in the upper east wing, with red roofing was added recently. Their layout reminds us of the blue-roofed buildings in and scattered around Xinjiang facilities, which we also have present: “This architecture is bang on a XJ prison, [though] with a different style roof”, Ruser said.

    https://miro.medium.com/max/512/1*GL1DwZmaqVdgUtaWsZHWdA.png

    https://miro.medium.com/max/303/1*Jr03h6ADK4_iNNfYP5YLkA.png
    https://miro.medium.com/max/328/1*RyzDtEa9SjE0WsBSwUaMfA.png

    The prison layout from the older prison facility above — with its long and vertically arranged wings and the rippled features — is similar to prisons seen in Xinjian, such as the two portrayed below (one at Qariqash County at 37° 6’44.88"N, 79°38’32.71"E and the other facility in 39°25’54.60”N, 76° 3’20.59"E).
    https://miro.medium.com/max/389/1*w01GGfJZZlcNCWm5MR4csQ.png

    Closing remarks:

    There is a mountain of stuff not included here. This is a training post and not an investigation with full-rested conclusion. This post should encourage other open-source investigative journalists to look into the facilities, follow their own reporting and help monitor developments/details that others may have missed.

    At present there are only a handful of OSINT journalists looking into it. Even fewer have the time to continuously keep this rolling, e.g. analysing the camps as other stories press them to move on.

    We need more eyes on this. The alleged human right abuse must receive all the international scrutiny it can get. People like Shawn Zhang and others with Nathan Ruser and APSI) started the journey. Other journalists must continue and expand on it.

    Also, the more open we are about sources and the analysis (hopefully) the fewer people might try to cast doubt on the existence of the camps (good thread here)

    OSINT techniques used must master the skill to help others to replicate the findings, step by step. That’s the reason this post resulted more in a hands-on tutorial than an explanatory post. I encourage anyone to start looking into the human rights abuse (though, I must stress, be careful to draw quick conclusions. Instead, share what you see on satellite images with the community of serious journalists and OSINT investigators).

    One last thought on commercial satellite imagery companies. It is crucial to get their support on this. For more than 100 camps mentioned in the latest update of the ASPI list (nearly 80 of them high-security detention facilities — classified as tier 3 or 4), we have no updated record of satellite images. This leaves researchers and journalists only to low-resolution devices, by Sentinel 2 images, or beg for images from Maxar or Planet Labs. That’s not good enough. Transparency requires companies inc to make those high-resolution images available, to anyone. Intelligence services should also consider making their high-resolution images available to the public for scrutiny, though, that unlikely to happen.

    https://medium.com/@techjournalism/open-source-satellite-data-to-investigate-xinjiang-concentration-camps-2713c
    #camps_de_concentration #architecture_forensique #images_satellitaires #rééducation #ré-éducation #camps_de_rééducation #Chine #droits_humains #droits_fondamentaux #Tibet

    ping @reka @isskein @visionscarto

    • I scripted a screen capture of 8000 xinjiang satellite images and uploaded them to here

      Detention Facilities in Xinjiang China : Google Earth Satellite Timelapse : 2002-2020 : 新疆看守所卫星延时摄影
      https://www.youtube.com/watch?v=fmoXVvU8G0c

      you can play them fast or find a location by latitude/longitude and step through one image at a time

      later i posted an addendum with another 20 sites, and showing China’s rebuttal to satellite evidence
      https://www.youtube.com/watch?v=KHc-TdusgaI

      other possible relevant sites not in ETNAM or ASPI datasets, that I saw in Google Earth
      46.917, 87.837
      43.958, 87.555
      43.450, 82.738
      40.594, 81.111
      40.567, 81.525
      40.563, 81.252
      40.069, 79.471
      39.947, 79.415
      39.270, 88.906
      39.269, 88.849
      39.247, 88.963
      38.197, 85.384
      37.004, 81.617

    • Cette région, c’est que des vergers et des champs entouré de semi-desert et irrigué par la Tarim et l’Hotan. Ca ne donne pas très envie d’y vivre. Donc je ne suis pas sur que des gens libres y travaillent. Donc tout ce qu’on y voit est potentiellement un camp de travail.

  • Farida : la victime n’était pas coupable – L’image sociale
    http://imagesociale.fr/8700

    Les images virales, comment ça marche ? Pour les journalistes comme pour le plupart des usagers du web, ces vidéos qui montrent un événement dramatique ou significatif sont des données qui émergent du terrain, de façon spontanée et naturelle, et constituent des faits objectifs dont l’intérêt est établi par leur diffusion même. Mais les images virales ne sont pas des faits objectifs : ce sont au contraire des récits en formation, des constructions sociales en temps réel, forgées par la conversation sur les réseaux sociaux. La lecture de ces séquences évolue rapidement en fonction de l’état du débat public, dont elles révèlent et orientent simultanément les contours.

  • Monitoring being pitched to fight Covid-19 was tested on refugees

    The pandemic has given a boost to controversial data-driven initiatives to track population movements

    In Italy, social media monitoring companies have been scouring Instagram to see who’s breaking the nationwide lockdown. In Israel, the government has made plans to “sift through geolocation data” collected by the Shin Bet intelligence agency and text people who have been in contact with an infected person. And in the UK, the government has asked mobile operators to share phone users’ aggregate location data to “help to predict broadly how the virus might move”.

    These efforts are just the most visible tip of a rapidly evolving industry combining the exploitation of data from the internet and mobile phones and the increasing number of sensors embedded on Earth and in space. Data scientists are intrigued by the new possibilities for behavioural prediction that such data offers. But they are also coming to terms with the complexity of actually using these data sets, and the ethical and practical problems that lurk within them.

    In the wake of the refugee crisis of 2015, tech companies and research consortiums pushed to develop projects using new data sources to predict movements of migrants into Europe. These ranged from broad efforts to extract intelligence from public social media profiles by hand, to more complex automated manipulation of big data sets through image recognition and machine learning. Two recent efforts have just been shut down, however, and others are yet to produce operational results.

    While IT companies and some areas of the humanitarian sector have applauded new possibilities, critics cite human rights concerns, or point to limitations in what such technological solutions can actually achieve.

    In September last year Frontex, the European border security agency, published a tender for “social media analysis services concerning irregular migration trends and forecasts”. The agency was offering the winning bidder up to €400,000 for “improved risk analysis regarding future irregular migratory movements” and support of Frontex’s anti-immigration operations.

    Frontex “wants to embrace” opportunities arising from the rapid growth of social media platforms, a contracting document outlined. The border agency believes that social media interactions drastically change the way people plan their routes, and thus examining would-be migrants’ online behaviour could help it get ahead of the curve, since these interactions typically occur “well before persons reach the external borders of the EU”.

    Frontex asked bidders to develop lists of key words that could be mined from platforms like Twitter, Facebook, Instagram and YouTube. The winning company would produce a monthly report containing “predictive intelligence ... of irregular flows”.

    Early this year, however, Frontex cancelled the opportunity. It followed swiftly on from another shutdown; Frontex’s sister agency, the European Asylum Support Office (EASO), had fallen foul of the European data protection watchdog, the EDPS, for searching social media content from would-be migrants.

    The EASO had been using the data to flag “shifts in asylum and migration routes, smuggling offers and the discourse among social media community users on key issues – flights, human trafficking and asylum systems/processes”. The search covered a broad range of languages, including Arabic, Pashto, Dari, Urdu, Tigrinya, Amharic, Edo, Pidgin English, Russian, Kurmanji Kurdish, Hausa and French.

    Although the EASO’s mission, as its name suggests, is centred around support for the asylum system, its reports were widely circulated, including to organisations that attempt to limit illegal immigration – Europol, Interpol, member states and Frontex itself.

    In shutting down the EASO’s social media monitoring project, the watchdog cited numerous concerns about process, the impact on fundamental rights and the lack of a legal basis for the work.

    “This processing operation concerns a vast number of social media users,” the EDPS pointed out. Because EASO’s reports are read by border security forces, there was a significant risk that data shared by asylum seekers to help others travel safely to Europe could instead be unfairly used against them without their knowledge.

    Social media monitoring “poses high risks to individuals’ rights and freedoms,” the regulator concluded in an assessment it delivered last November. “It involves the use of personal data in a way that goes beyond their initial purpose, their initial context of publication and in ways that individuals could not reasonably anticipate. This may have a chilling effect on people’s ability and willingness to express themselves and form relationships freely.”

    EASO told the Bureau that the ban had “negative consequences” on “the ability of EU member states to adapt the preparedness, and increase the effectiveness, of their asylum systems” and also noted a “potential harmful impact on the safety of migrants and asylum seekers”.

    Frontex said that its social media analysis tender was cancelled after new European border regulations came into force, but added that it was considering modifying the tender in response to these rules.
    Coronavirus

    Drug shortages put worst-hit Covid-19 patients at risk
    European doctors running low on drugs needed to treat Covid-19 patients
    Big Tobacco criticised for ’coronavirus publicity stunt’ after donating ventilators

    The two shutdowns represented a stumbling block for efforts to track population movements via new technologies and sources of data. But the public health crisis precipitated by the Covid-19 virus has brought such efforts abruptly to wider attention. In doing so it has cast a spotlight on a complex knot of issues. What information is personal, and legally protected? How does that protection work? What do concepts like anonymisation, privacy and consent mean in an age of big data?
    The shape of things to come

    International humanitarian organisations have long been interested in whether they can use nontraditional data sources to help plan disaster responses. As they often operate in inaccessible regions with little available or accurate official data about population sizes and movements, they can benefit from using new big data sources to estimate how many people are moving where. In particular, as well as using social media, recent efforts have sought to combine insights from mobile phones – a vital possession for a refugee or disaster survivor – with images generated by “Earth observation” satellites.

    “Mobiles, satellites and social media are the holy trinity of movement prediction,” said Linnet Taylor, professor at the Tilburg Institute for Law, Technology and Society in the Netherlands, who has been studying the privacy implications of such new data sources. “It’s the shape of things to come.”

    As the devastating impact of the Syrian civil war worsened in 2015, Europe saw itself in crisis. Refugee movements dominated the headlines and while some countries, notably Germany, opened up to more arrivals than usual, others shut down. European agencies and tech companies started to team up with a new offering: a migration hotspot predictor.

    Controversially, they were importing a concept drawn from distant catastrophe zones into decision-making on what should happen within the borders of the EU.

    “Here’s the heart of the matter,” said Nathaniel Raymond, a lecturer at the Yale Jackson Institute for Global Affairs who focuses on the security implications of information communication technologies for vulnerable populations. “In ungoverned frontier cases [European data protection law] doesn’t apply. Use of these technologies might be ethically safer there, and in any case it’s the only thing that is available. When you enter governed space, data volume and ease of manipulation go up. Putting this technology to work in the EU is a total inversion.”
    “Mobiles, satellites and social media are the holy trinity of movement prediction”

    Justin Ginnetti, head of data and analysis at the Internal Displacement Monitoring Centre in Switzerland, made a similar point. His organisation monitors movements to help humanitarian groups provide food, shelter and aid to those forced from their homes, but he casts a skeptical eye on governments using the same technology in the context of migration.

    “Many governments – within the EU and elsewhere – are very interested in these technologies, for reasons that are not the same as ours,” he told the Bureau. He called such technologies “a nuclear fly swatter,” adding: “The key question is: What problem are you really trying to solve with it? For many governments, it’s not preparing to ‘better respond to inflow of people’ – it’s raising red flags, to identify those en route and prevent them from arriving.”
    Eye in the sky

    A key player in marketing this concept was the European Space Agency (ESA) – an organisation based in Paris, with a major spaceport in French Guiana. The ESA’s pitch was to combine its space assets with other people’s data. “Could you be leveraging space technology and data for the benefit of life on Earth?” a recent presentation from the organisation on “disruptive smart technologies” asked. “We’ll work together to make your idea commercially viable.”

    By 2016, technologists at the ESA had spotted an opportunity. “Europe is being confronted with the most significant influxes of migrants and refugees in its history,” a presentation for their Advanced Research in Telecommunications Systems Programme stated. “One burning issue is the lack of timely information on migration trends, flows and rates. Big data applications have been recognised as a potentially powerful tool.” It decided to assess how it could harness such data.

    The ESA reached out to various European agencies, including EASO and Frontex, to offer a stake in what it called “big data applications to boost preparedness and response to migration”. The space agency would fund initial feasibility stages, but wanted any operational work to be jointly funded.

    One such feasibility study was carried out by GMV, a privately owned tech group covering banking, defence, health, telecommunications and satellites. GMV announced in a press release in August 2017 that the study would “assess the added value of big data solutions in the migration sector, namely the reduction of safety risks for migrants, the enhancement of border controls, as well as prevention and response to security issues related with unexpected migration movements”. It would do this by integrating “multiple space assets” with other sources including mobile phones and social media.

    When contacted by the Bureau, a spokeswoman from GMV said that, contrary to the press release, “nothing in the feasibility study related to the enhancement of border controls”.

    In the same year, the technology multinational CGI teamed up with the Dutch Statistics Office to explore similar questions. They started by looking at data around asylum flows from Syria and at how satellite images and social media could indicate changes in migration patterns in Niger, a key route into Europe. Following this experiment, they approached EASO in October 2017. CGI’s presentation of the work noted that at the time EASO was looking for a social media analysis tool that could monitor Facebook groups, predict arrivals of migrants at EU borders, and determine the number of “hotspots” and migrant shelters. CGI pitched a combined project, co-funded by the ESA, to start in 2019 and expand to serve more organisations in 2020.
    The proposal was to identify “hotspot activities”, using phone data to group individuals “according to where they spend the night”

    The idea was called Migration Radar 2.0. The ESA wrote that “analysing social media data allows for better understanding of the behaviour and sentiments of crowds at a particular geographic location and a specific moment in time, which can be indicators of possible migration movements in the immediate future”. Combined with continuous monitoring from space, the result would be an “early warning system” that offered potential future movements and routes, “as well as information about the composition of people in terms of origin, age, gender”.

    Internal notes released by EASO to the Bureau show the sheer range of companies trying to get a slice of the action. The agency had considered offers of services not only from the ESA, GMV, the Dutch Statistics Office and CGI, but also from BIP, a consulting firm, the aerospace group Thales Alenia, the geoinformation specialist EGEOS and Vodafone.

    Some of the pitches were better received than others. An EASO analyst who took notes on the various proposals remarked that “most oversell a bit”. They went on: “Some claimed they could trace GSM [ie mobile networks] but then clarified they could do it for Venezuelans only, and maybe one or two countries in Africa.” Financial implications were not always clearly provided. On the other hand, the official noted, the ESA and its consortium would pay 80% of costs and “we can get collaboration on something we plan to do anyway”.

    The features on offer included automatic alerts, a social media timeline, sentiment analysis, “animated bubbles with asylum applications from countries of origin over time”, the detection and monitoring of smuggling sites, hotspot maps, change detection and border monitoring.

    The document notes a group of services available from Vodafone, for example, in the context of a proposed project to monitor asylum centres in Italy. The proposal was to identify “hotspot activities”, using phone data to group individuals either by nationality or “according to where they spend the night”, and also to test if their movements into the country from abroad could be back-tracked. A tentative estimate for the cost of a pilot project, spread over four municipalities, came to €250,000 – of which an unspecified amount was for “regulatory (privacy) issues”.

    Stumbling blocks

    Elsewhere, efforts to harness social media data for similar purposes were proving problematic. A September 2017 UN study tried to establish whether analysing social media posts, specifically on Twitter, “could provide insights into ... altered routes, or the conversations PoC [“persons of concern”] are having with service providers, including smugglers”. The hypothesis was that this could “better inform the orientation of resource allocations, and advocacy efforts” - but the study was unable to conclude either way, after failing to identify enough relevant data on Twitter.

    The ESA pressed ahead, with four feasibility studies concluding in 2018 and 2019. The Migration Radar project produced a dashboard that showcased the use of satellite imagery for automatically detecting changes in temporary settlement, as well as tools to analyse sentiment on social media. The prototype received positive reviews, its backers wrote, encouraging them to keep developing the product.

    CGI was effusive about the predictive power of its technology, which could automatically detect “groups of people, traces of trucks at unexpected places, tent camps, waste heaps and boats” while offering insight into “the sentiments of migrants at certain moments” and “information that is shared about routes and motives for taking certain routes”. Armed with this data, the company argued that it could create a service which could predict the possible outcomes of migration movements before they happened.

    The ESA’s other “big data applications” study had identified a demand among EU agencies and other potential customers for predictive analyses to ensure “preparedness” and alert systems for migration events. A package of services was proposed, using data drawn from social media and satellites.

    Both projects were slated to evolve into a second, operational phase. But this seems to have never become reality. CGI told the Bureau that “since the completion of the [Migration Radar] project, we have not carried out any extra activities in this domain”.

    The ESA told the Bureau that its studies had “confirmed the usefulness” of combining space technology and big data for monitoring migration movements. The agency added that its corporate partners were working on follow-on projects despite “internal delays”.

    EASO itself told the Bureau that it “took a decision not to get involved” in the various proposals it had received.

    Specialists found a “striking absence” of agreed upon core principles when using the new technologies

    But even as these efforts slowed, others have been pursuing similar goals. The European Commission’s Knowledge Centre on Migration and Demography has proposed a “Big Data for Migration Alliance” to address data access, security and ethics concerns. A new partnership between the ESA and GMV – “Bigmig" – aims to support “migration management and prevention” through a combination of satellite observation and machine-learning techniques (the company emphasised to the Bureau that its focus was humanitarian). And a consortium of universities and private sector partners – GMV among them – has just launched a €3 million EU-funded project, named Hummingbird, to improve predictions of migration patterns, including through analysing phone call records, satellite imagery and social media.

    At a conference in Berlin in October 2019, dozens of specialists from academia, government and the humanitarian sector debated the use of these new technologies for “forecasting human mobility in contexts of crises”. Their conclusions raised numerous red flags. They found a “striking absence” of agreed upon core principles. It was hard to balance the potential good with ethical concerns, because the most useful data tended to be more specific, leading to greater risks of misuse and even, in the worst case scenario, weaponisation of the data. Partnerships with corporations introduced transparency complications. Communication of predictive findings to decision makers, and particularly the “miscommunication of the scope and limitations associated with such findings”, was identified as a particular problem.

    The full consequences of relying on artificial intelligence and “employing large scale, automated, and combined analysis of datasets of different sources” to predict movements in a crisis could not be foreseen, the workshop report concluded. “Humanitarian and political actors who base their decisions on such analytics must therefore carefully reflect on the potential risks.”

    A fresh crisis

    Until recently, discussion of such risks remained mostly confined to scientific papers and NGO workshops. The Covid-19 pandemic has brought it crashing into the mainstream.

    Some see critical advantages to using call data records to trace movements and map the spread of the virus. “Using our mobile technology, we have the potential to build models that help to predict broadly how the virus might move,” an O2 spokesperson said in March. But others believe that it is too late for this to be useful. The UK’s chief scientific officer, Patrick Vallance, told a press conference in March that using this type of data “would have been a good idea in January”.

    Like the 2015 refugee crisis, the global emergency offers an opportunity for industry to get ahead of the curve with innovative uses of big data. At a summit in Downing Street on 11 March, Dominic Cummings asked tech firms “what [they] could bring to the table” to help the fight against Covid-19.

    Human rights advocates worry about the longer term effects of such efforts, however. “Right now, we’re seeing states around the world roll out powerful new surveillance measures and strike up hasty partnerships with tech companies,” Anna Bacciarelli, a technology researcher at Amnesty International, told the Bureau. “While states must act to protect people in this pandemic, it is vital that we ensure that invasive surveillance measures do not become normalised and permanent, beyond their emergency status.”

    More creative methods of surveillance and prediction are not necessarily answering the right question, others warn.

    “The single largest determinant of Covid-19 mortality is healthcare system capacity,” said Sean McDonald, a senior fellow at the Centre for International Governance Innovation, who studied the use of phone data in the west African Ebola outbreak of 2014-5. “But governments are focusing on the pandemic as a problem of people management rather than a problem of building response capacity. More broadly, there is nowhere near enough proof that the science or math underlying the technologies being deployed meaningfully contribute to controlling the virus at all.”

    Legally, this type of data processing raises complicated questions. While European data protection law - the GDPR - generally prohibits processing of “special categories of personal data”, including ethnicity, beliefs, sexual orientation, biometrics and health, it allows such processing in a number of instances (among them public health emergencies). In the case of refugee movement prediction, there are signs that the law is cracking at the seams.
    “There is nowhere near enough proof that the science or math underlying the technologies being deployed meaningfully contribute to controlling the virus at all.”

    Under GDPR, researchers are supposed to make “impact assessments” of how their data processing can affect fundamental rights. If they find potential for concern they should consult their national information commissioner. There is no simple way to know whether such assessments have been produced, however, or whether they were thoroughly carried out.

    Researchers engaged with crunching mobile phone data point to anonymisation and aggregation as effective tools for ensuring privacy is maintained. But the solution is not straightforward, either technically or legally.

    “If telcos are using individual call records or location data to provide intel on the whereabouts, movements or activities of migrants and refugees, they still need a legal basis to use that data for that purpose in the first place – even if the final intelligence report itself does not contain any personal data,” said Ben Hayes, director of AWO, a data rights law firm and consultancy. “The more likely it is that the people concerned may be identified or affected, the more serious this matter becomes.”

    More broadly, experts worry that, faced with the potential of big data technology to illuminate movements of groups of people, the law’s provisions on privacy begin to seem outdated.

    “We’re paying more attention now to privacy under its traditional definition,” Nathaniel Raymond said. “But privacy is not the same as group legibility.” Simply put, while issues around the sensitivity of personal data can be obvious, the combinations of seemingly unrelated data that offer insights about what small groups of people are doing can be hard to foresee, and hard to mitigate. Raymond argues that the concept of privacy as enshrined in the newly minted data protection law is anachronistic. As he puts it, “GDPR is already dead, stuffed and mounted. We’re increasing vulnerability under the colour of law.”

    https://www.thebureauinvestigates.com/stories/2020-04-28/monitoring-being-pitched-to-fight-covid-19-was-first-tested-o
    #cobaye #surveillance #réfugiés #covid-19 #coronavirus #test #smartphone #téléphones_portables #Frontex #frontières #contrôles_frontaliers #Shin_Bet #internet #big_data #droits_humains #réseaux_sociaux #intelligence_prédictive #European_Asylum_Support_Office (#EASO) #EDPS #protection_des_données #humanitaire #images_satellites #technologie #European_Space_Agency (#ESA) #GMV #CGI #Niger #Facebook #Migration_Radar_2.0 #early_warning_system #BIP #Thales_Alenia #EGEOS #complexe_militaro-industriel #Vodafone #GSM #Italie #twitter #détection #routes_migratoires #systèmes_d'alerte #satellites #Knowledge_Centre_on_Migration_and_Demography #Big_Data for_Migration_Alliance #Bigmig #machine-learning #Hummingbird #weaponisation_of_the_data #IA #intelligence_artificielle #données_personnelles

    ping @etraces @isskein @karine4 @reka

    signalé ici par @sinehebdo :
    https://seenthis.net/messages/849167

  • #catalogue de #films sur les #migrations

    La #liste de films ci-après a été réalisée par le RÉSEAU TRACES afin de faciliter la diffusion publique de films, l’organisation de projections qui seraient l’occasion d’échanges, mais également pour alimenter toute démarche de recherche. Cette liste est bien sûr non exhaustive et sera mise à jour très régulièrement. Il s’agit de films qui sont recommandés par des membres du réseau Traces dans une grande diversité.

    Nous tenons à votre disposition des liens de visionnement de la plupart des films, en accord avec leurs distributeurs, sur simple demande par email à reseau.traces@gmail.com.

    Nous pouvons aussi vous conseiller et vous orienter dans cette liste en fonction de thématiques ou de sensibilités qui vous intéresseraient plus particulièrement.

    http://traces-migrations.org/2020/04/09/films-sur-les-migrations
    #réseau_traces #cinéma
    #réfugiés #frontières #ressources_pédagogiques

    Liste de OUF ! #wow

    ping @isskein @_kg_ @karine4 @sinehebdo @reka

  • Le #Centre_National_d’Etudes_Spatiales – le C.N.E.S. – s’est doté il y a un an d’un nouveau site : #Géoimage.

    https://geoimage.cnes.fr/fr

    Les #images_satellites sont devenues incontournables dans de nombreuses pratiques journalières, personnelles ou professionnelles. Il semblait impensable d’en laisser le monopole à Google ou à la NASA, alors que la stratégie spatiale de la France nous permet de disposer d’outils reconnus pour leurs qualités à l’échelle mondiale.

    Le site met déjà en ligne 230 dossiers couvrant 68 Etats et territoires, rédigées par 138 auteurs - PR, DR CNRS, MdC, docteurs, doctorants, ATER, enseignants de prépas ou du secondaire - dont H. Théry, T. Sanjuan, F. Bart, B. Merenne, JC Gay. B. Hourcade, F. Ballanche, Y. Boquet, S. Dewel, C. Fleury ; B. Lecoquierre., F. Tétart, J. Thorez... 80 dossiers sont en préparation.

    L’accès aux dossiers est organisé par pays/continents, par grands thèmes, par concours et par programmes scolaires. Pour les universités, ce site offre aussi de nombreuses ressources mobilisables par vos étudiants dès la 1er année.

    Enfin, notre communauté présente une accumulation exceptionnelle de connaissances et d’analyses sur la France et le monde. Dans certaines conditions, le CNES peut disposer d’une couverture mondiale à 10 m de précision au sol, souvent moins sur la France.

    Nous sommes aussi à la recherche d’auteurs sur des territoires très différents (par ex. Amman, Berne, Assouan, Le Caire, Nicosie, Tarente, Montevideo, Potosi, Toronto, Tallinn, Varsovie, les îles Iriomote dans les Ryukyu, le Sakurajima à Kyushu, Détroit, Yuma, Kuala Lumpur …). Vous pouvez tout autant nous présenter des propositions.

    Les textes peuvent être fournis en bi-lingue en anglais, espagnol, italien, allemand… (cf. entrée langues étrangères). Au total, un beau projet collectif d’encyclopédie géographique spatiale francophone en ligne porté par une grande entreprise publique nationale et auquel chacun peut apporter sa contribution..

    Puis par ces temps de confinement, faites voyager vos étudiants, vos amis, vos familles, vos enfants ou petits-enfants. De Bora Bora à Venise ou Reykjavik, de Pékin à Londres ou Moscou, d’Astana à Brasilia ou Djibouti, du Mont St Michel à Lyon ou Paris, de Yamal à Kolwesi ou Phuket, de la Passe de Khyber à Guantanamo ou Kaliningrad.

    ping @reka @fil @albertocampiphoto

    #images_satellitaires

  • Le fichage. Note d’analyse ANAFE
    Un outil sans limites au service du contrôle des frontières ?

    La traversée des frontières par des personnes étrangères est un « outil » politique et médiatique, utilisé pour faire accepter à la population toutes les mesures toujours plus attentatoires aux libertés individuelles, au nom par exemple de la lutte contre le terrorisme. Le prétexte sécuritaire est érigé en étendard et il est systématiquement brandi dans les discours politiques, assimilant ainsi migration et criminalité, non seulement pour des effets d’annonce mais de plus en plus dans les législations.
    Les personnes étrangères font depuis longtemps l’objet de mesures de contrôle et de surveillance. Pourtant, un changement de perspective s’est opéré pour s’adapter aux grands changements des politiques européennes vers une criminalisation croissante de ces personnes, en lien avec le développement constant des nouvelles technologies. L’utilisation exponentielle des fichiers est destinée à identifier, catégoriser, contrôler, éloigner et exclure. Et si le fichage est utilisé pour bloquer les personnes sur leurs parcours migratoires, il est aussi de plus en plus utilisé pour entraver les déplacements à l’intérieur de l’Union et l’action de militants européens qui entendent apporter leur soutien aux personnes exilées.
    Quelles sont les limites à ce développement ? Les possibilités techniques et numériques semblent illimitées et favorisent alors un véritable « business » du fichage.

    Concrètement, il existe pléthore de fichiers. Leur complexité tient au fait qu’ils sont nombreux, mais également à leur superposition. De ce maillage opaque naît une certaine insécurité juridique pour les personnes visées.
    Parallèlement à la multiplication des fichiers de tout type et de toute nature, ce sont désormais des questions liées à leur interconnexion[1], à leurs failles qui sont soulevées et aux abus dans leur utilisation, notamment aux risques d’atteintes aux droits fondamentaux et aux libertés publiques.

    Le 5 février 2019, un accord provisoire a été signé entre la présidence du Conseil européen et le Parlement européen sur l’interopérabilité[2] des systèmes d’information au niveau du continent pour renforcer les contrôles aux frontières de l’Union.

    http://www.anafe.org/IMG/pdf/note_-_le_fichage_un_outil_sans_limites_au_service_du_controle_des_frontieres

    #frontières #contrôle #surveillance #migration #réfugiés #fichage #interconnexion #interopérabilité

  • Brazil space institute director sacked in Amazon deforestation row | World news | The Guardian

    https://www.theguardian.com/world/2019/aug/02/brazil-space-institute-director-sacked-in-amazon-deforestation-row
    https://i.guim.co.uk/img/media/e9deda97cf0953a32d4576b77bc73fc9c92e6367/0_233_3500_2100/master/3500.jpg?width=1200&height=630&quality=85&auto=format&fit=crop&overlay-ali

    The director of Brazil’s National Space Research Institute (INPE) has been sacked in the midst of a controversy over its satellite data showing a rise in Amazon deforestation, which the far-right president, Jair Bolsonaro, has called “lies”.

    Ricardo Galvão, who had defended the institute and criticised Bolsonaro’s attack, was dismissed on Friday after a meeting with the science and technology minister, Marcos Pontes.

    #brésil #déforestation #censure #statistiques #cartographie #images_satellites #manipulation

    • Brésil : Jair Bolsonaro licencie le directeur de l’institut divulguant les données sur la déforestation
      https://www.lemonde.fr/international/article/2019/08/02/bresil-jair-bolsonaro-licencie-le-directeur-de-l-institut-divulguant-les-don

      Ricardo Galvão était accusé par le président brésilien d’exagérer l’ampleur de la destruction de la forêt amazonienne pour faire le jeu des ONG.

      Il avait promis de tenir bon, mais, face à la fureur de Jair Bolsonaro, a fini par plier, quitte à aggraver la tragédie environnementale en cours au Brésil. Vendredi 2 août, à l’issue d’un entretien à Brasilia avec Marcos Pontes, son ministre de tutelle, à la tête des sciences et de la technologie, le directeur de l’Institut national de recherches spatiales (INPE), Ricardo Galvão, a annoncé son départ. « Mon propos sur le président a suscité de l’embarras, je serai donc exonéré de mes fonctions », a-t-il annoncé, évoquant une situation de « perte de confiance ».

      Le directeur de l’INPE, institut chargé, notamment, de divulguer les chiffres sur la déforestation amazonienne, était dans le viseur du chef de l’Etat depuis plusieurs semaines. Jair Bolsonaro a peu apprécié que l’organisme fasse état au grand jour de l’ampleur de la destruction de la forêt native brésilienne, divulguant mois après mois des données chaque fois plus effrayantes : 739 km2 de forêt détruits en mai, soit une hausse de 34 % par rapport au même mois l’année passée ou l’équivalent de deux terrains de football rasés chaque minute, puis 920 km2 en juin (+88 %) et encore 1 864 km2 en juillet (+212 %). « Un cauchemar », souffle une source au sein de l’Observatoire du climat, ONG environnementale brésilienne.

  • L’ONG #Sea-Eye va identifier les embarcations en détresse grâce aux #images_satellites

    L’ONG allemande Sea-Eye se lance dans un nouveau projet : le #Space-Eye. Objectif : utiliser les images satellites d’une société privée pour alerter sur la présence de migrants en détresse au large de la Libye, et documenter d’éventuelles violations des droits de l’Homme.

    Après les navires humanitaires et les avions de reconnaissance qui sillonnent les côtes libyennes à la recherche d’embarcations de migrants en détresse, Sea-Eye s’intéresse désormais aux images satellite avec un nouveau projet, Space-Eye. L’ONG allemande vient de signer un contrat avec Planet, une société privée américaine de fournisseur d’images satellites, afin de surveiller les côtes libyennes.

    Les images satellites fournies permettront à Sea-Eye d’alerter les ONG présentes au large de la Libye ou le MRCC italien et maltais, lorsqu’un navire est en difficulté.

    Mais ce n’est pas la seule mission que s’est donné Space-Eye. L’ONG cherche aussi à recenser les canots qui n’ont pas pu être secourus ; comment ? En comparant les images satellites actuelles à celles plus anciennes. En effet, #Planet peut fournir des images remontant sur plusieurs années, qu’elle garde en stock.

    « On veut ainsi vérifier si Frontex [garde-côtes européens, ndlr] vient secourir les migrants ou non lorsqu’ils reçoivent un appel de détresse. On a des doutes. Avec les images satellites et les signaux émis par Frontex, on pourra y voir plus clair », explique à InfoMigrants Hans-Peter Buschheuer, chargé de la communication de Space-Eye.

    La zone de surveillance définie englobe 4 500 kilomètres, au large des côtes libyennes. Elle s’étend sur 100 km de long et 30 km de large, au plus près de la région où les départs sont les plus importants.

    Pour l’ONG, ce projet est nécessaire car la politique européenne les inquiète. En effet, l’Italie n’accueille plus aucun navire sur son sol depuis l’arrivée au pouvoir de Matteo Salvini l’année dernière. Pire, les navires humanitaires sont régulièrement maintenus à quai dans les ports européens. « On pense qu’à terme il n’y aura plus aucun navire humanitaire dans la zone et que les avions comme le #Moonbird seront cloués au sol. Les images satellites seront le seul moyen de surveiller ce qu’il se passe le long des côtes libyennes », précise encore Hans-Peter Buschheuer.
    Space-Eye espère publier un rapport sur d’éventuelles violations des droits de l’Homme au large de la Libye dans les prochains mois.

    https://www.infomigrants.net/fr/post/15933/l-ong-sea-eye-va-identifier-les-embarcations-en-detresse-grace-aux-ima
    #sauvetage #Méditerranée #ONG #asile #migrations #réfugiés #nouvelle_stratégie #droits_humains #forensic_architecture

    métaliste ici :
    https://seenthis.net/messages/706177

  • Un projet de #fichage géant des citoyens non membres de l’#UE prend forme en #Europe

    Un accord provisoire a été signé le 5 février entre la présidence du Conseil européen et le Parlement européen pour renforcer les contrôles aux frontières de l’Union. Il va consolider la mise en commun de fichiers de données personnelles. Les défenseurs des libertés individuelles s’alarment.

    Des appareils portables équipés de lecteurs d’#empreintes_digitales et d’#images_faciales, pour permettre aux policiers de traquer des terroristes : ce n’est plus de la science-fiction, mais un projet européen en train de devenir réalité. Le 5 février 2019, un accord préliminaire sur l’#interopérabilité des #systèmes_d'information au niveau du continent a ainsi été signé.

    Il doit permettre l’unification de six #registres avec des données d’#identification_alphanumériques et biométriques (empreintes digitales et images faciales) de citoyens non membres de l’UE. En dépit des nombreuses réserves émises par les Cnil européennes.

    Giovanni Buttarelli, contrôleur européen de la protection des données, a qualifié cette proposition de « point de non-retour » dans le système de base de données européen. En substance, les registres des demandeurs d’asile (#Eurodac), des demandeurs de visa pour l’Union européenne (#Visa) et des demandeurs (système d’information #Schengen) seront joints à trois nouvelles bases de données mises en place ces derniers mois, toutes concernant des citoyens non membres de l’UE.

    Pourront ainsi accéder à la nouvelle base de données les forces de police des États membres, mais aussi les responsables d’#Interpol, d’#Europol et, dans de nombreux cas, même les #gardes-frontières de l’agence européenne #Frontex. Ils pourront rechercher des personnes par nom, mais également par empreinte digitale ou faciale, et croiser les informations de plusieurs bases de données sur une personne.

    « L’interopérabilité peut consister en un seul registre avec des données isolées les unes des autres ou dans une base de données centralisée. Cette dernière hypothèse peut comporter des risques graves de perte d’informations sensibles, explique Buttarelli. Le choix entre les deux options est un détail fondamental qui sera clarifié au moment de la mise en œuvre. »

    Le Parlement européen et le Conseil doivent encore approuver officiellement l’accord, avant qu’il ne devienne législation.

    Les #risques de la méga base de données

    « J’ai voté contre l’interopérabilité parce que c’est une usine à gaz qui n’est pas conforme aux principes de proportionnalité, de nécessité et de finalité que l’on met en avant dès lors qu’il peut être question d’atteintes aux droits fondamentaux et aux libertés publiques, assure Marie-Christine Vergiat, députée européenne, membre de la commission des libertés civiles. On mélange tout : les autorités de contrôle aux #frontières et les autorités répressives par exemple, alors que ce ne sont pas les mêmes finalités. »

    La proposition de règlement, élaborée par un groupe d’experts de haut niveau d’institutions européennes et d’États membres, dont les noms n’ont pas été révélés, avait été présentée par la Commission en décembre 2017, dans le but de prévenir les attaques terroristes et de promouvoir le contrôle aux frontières.

    Les institutions de l’UE sont pourtant divisées quant à son impact sur la sécurité des citoyens : d’un côté, Krum Garkov, directeur de #Eu-Lisa – l’agence européenne chargée de la gestion de l’immense registre de données –, estime qu’elle va aider à prévenir les attaques et les terroristes en identifiant des criminels sous de fausses identités. De l’autre côté, Giovanni Buttarelli met en garde contre une base de données centralisée, qui risque davantage d’être visée par des cyberattaques. « Nous ne devons pas penser aux simples pirates, a-t-il déclaré. Il y a des puissances étrangères très intéressées par la vulnérabilité de ces systèmes. »

    L’utilité pour l’antiterrorisme : les doutes des experts

    L’idée de l’interopérabilité des systèmes d’information est née après le 11-Septembre. Elle s’est développée en Europe dans le contexte de la crise migratoire et des attentats de 2015, et a été élaborée dans le cadre d’une relation de collaboration étroite entre les institutions européennes chargées du contrôle des frontières et l’industrie qui développe les technologies pour le mettre en œuvre.

    « L’objectif de lutte contre le terrorisme a disparu : on parle maintenant de “#fraude_à_l'identité”, et l’on mélange de plus en plus lutte contre la #criminalité et lutte contre l’immigration dite irrégulière, ajoute Vergiat. J’ai participé à la commission spéciale du Parlement européen sur la #lutte_contre_le_terrorisme ; je sais donc que le lien entre #terrorisme et #immigration dite irrégulière est infinitésimal. On compte les cas de ressortissants de pays tiers arrêtés pour faits de terrorisme sur les doigts d’une main. »

    Dans la future base de données, « un référentiel d’identité unique collectera les données personnelles des systèmes d’information des différents pays, tandis qu’un détecteur d’identités multiples reliera les différentes identités d’un même individu », a déclaré le directeur d’Eu-Lisa, lors de la conférence annuelle de l’#Association_européenne_de_biométrie (#European_Association_for_Biometrics#EAB) qui réunit des représentants des fabricants des technologies de #reconnaissance_numérique nécessaires à la mise en œuvre du système.

    « Lors de l’attaque de Berlin, perpétrée par le terroriste Anis Amri, nous avons constaté que cet individu avait 14 identités dans l’Union européenne, a-t-il expliqué. Il est possible que, s’il y avait eu une base de données interopérable, il aurait été arrêté auparavant. »

    Cependant, Reinhard Kreissl, directeur du Vienna Centre for Societal Security (Vicesse) et expert en matière de lutte contre le terrorisme, souligne que, dans les attentats terroristes perpétrés en Europe ces dix dernières années, « les auteurs étaient souvent des citoyens européens, et ne figuraient donc pas dans des bases de données qui devaient être unifiées. Et tous étaient déjà dans les radars des forces de police ».

    « Tout agent des services de renseignement sérieux admettra qu’il dispose d’une liste de 1 000 à 1 500 individus dangereux, mais qu’il ne peut pas les suivre tous, ajoute Kreissl. Un trop-plein de données n’aide pas la police. »

    « L’interopérabilité coûte des milliards de dollars et l’intégration de différents systèmes n’est pas aussi facile qu’il y paraît », déclare Sandro Gaycken, directeur du Digital Society Institute à l’Esmt de Berlin. « Il est préférable d’investir dans l’intelligence des gens, dit l’expert en cyberintelligence, afin d’assurer plus de #sécurité de manière moins intrusive pour la vie privée. »

    Le #budget frontière de l’UE augmente de 197 %

    La course aux marchés publics pour la mise en place de la nouvelle base de données est sur le point de commencer : dans le chapitre consacré aux dépenses « Migration et contrôle des frontières » du budget proposé par la Commission pour la période 2021-2027, le fonds de gestion des frontières a connu une augmentation de 197 %, tandis que la part consacrée aux politiques de migration et d’asile n’a augmenté, en comparaison, que de 36 %.

    En 2020, le système #Entry_Exit (#Ees, ou #SEE, l’une des trois nouvelles bases de données centralisées avec interopérabilité) entrera en vigueur. Il oblige chaque État membre à collecter les empreintes digitales et les images de visages de tous les citoyens non européens entrant et sortant de l’Union, et d’alerter lorsque les permis de résidence expirent.

    Cela signifie que chaque frontière, aéroportuaire, portuaire ou terrestre, doit être équipée de lecteurs d’empreintes digitales et d’images faciales. La Commission a estimé que ce SEE coûterait 480 millions d’euros pour les quatre premières années. Malgré l’énorme investissement de l’Union, de nombreuses dépenses resteront à la charge des États membres.

    Ce sera ensuite au tour d’#Etias (#Système_européen_d’information_de_voyage_et_d’autorisation), le nouveau registre qui établit un examen préventif des demandes d’entrée, même pour les citoyens de pays étrangers qui n’ont pas besoin de visa pour entrer dans l’UE. Cette dernière a estimé son coût à 212,1 millions d’euros, mais le règlement, en plus de prévoir des coûts supplémentaires pour les États, mentionne des « ressources supplémentaires » à garantir aux agences de l’UE responsables de son fonctionnement, en particulier pour les gardes-côtes et les gardes-frontières de Frontex.

    C’est probablement la raison pour laquelle le #budget proposé pour Frontex a plus que triplé pour les sept prochaines années, pour atteindre 12 milliards d’euros. Le tout dans une ambiance de conflits d’intérêts entre l’agence européenne et l’industrie de la biométrie.

    Un membre de l’unité recherche et innovation de Frontex siège ainsi au conseil d’administration de l’#Association_européenne_de_biométrie (#EAB), qui regroupe les principales organisations de recherche et industrielles du secteur de l’identification numérique, et fait aussi du lobbying. La conférence annuelle de l’association a été parrainée par le géant biométrique français #Idemia et la #Security_Identity_Alliance.

    L’agente de recherche de Frontex et membre du conseil d’EAB Rasa Karbauskaite a ainsi suggéré à l’auditoire de représentants de l’industrie de participer à la conférence organisée par Frontex avec les États membres : « L’occasion de montrer les dernières technologies développées. » Un représentant de l’industrie a également demandé à Karbauskaite d’utiliser son rôle institutionnel pour faire pression sur l’Icao, l’agence des Nations unies chargée de la législation des passeports, afin de rendre les technologies de sécurité des données biométriques obligatoires pour le monde entier.

    La justification est toujours de « protéger les citoyens européens du terrorisme international », mais il n’existe toujours aucune donnée ou étude sur la manière dont les nouveaux registres de données biométriques et leur interconnexion peuvent contribuer à cet objectif.

    https://www.mediapart.fr/journal/international/250219/un-projet-de-fichage-geant-de-citoyens-prend-forme-en-europe
    #surveillance_de_masse #surveillance #étrangers #EU #anti-terrorisme #big-data #biométrie #complexe_militaro-industriel #business

    • Règlement (UE) 2019/817 du Parlement européen et du Conseil du 20 mai 2019 portant établissement d’un cadre pour l’interopérabilité des systèmes d’information de l’UE dans le domaine des frontières et des visas

      Point 9 du préambule du règlement UE 2019/817

      "Dans le but d’améliorer l’efficacité et l’efficience des vérifications aux frontières extérieures, de contribuer à prévenir et combattre l’immigration illégale et de favoriser un niveau élevé de sécurité au sein de l’espace de liberté, de sécurité et de justice de l’Union, y compris la préservation de la sécurité publique et de l’ordre public et la sauvegarde de la sécurité sur les territoires des États membres, d’améliorer la mise en œuvre de la politique commune des visas, d’aider dans l’examen des demandes de protection internationale, de contribuer à la prévention et à la détection des infractions terroristes et d’autres infractions pénales graves et aux enquêtes en la matière, de faciliter l’identification de personnes inconnues qui ne sont pas en mesure de s’identifier elles-mêmes ou des restes humains non identifiés en cas de catastrophe naturelle, d’accident ou d’attaque terroriste, afin de préserver la confiance des citoyens à l’égard du régime d’asile et de migration de l’Union, des mesures de sécurité de l’Union et de la capacité de l’Union à gérer les frontières extérieures, il convient d’établir l’interopérabilité des systèmes d’information de l’UE, à savoir le système d’entrée/de sortie (EES), le système d’information sur les visas (VIS), le système européen d’information et d’autorisation concernant les voyages (ETIAS), Eurodac, le système d’information Schengen (SIS) et le système européen d’information sur les casiers judiciaires pour les ressortissants de pays tiers (ECRIS-TCN), afin que lesdits systèmes d’information de l’UE et leurs données se complètent mutuellement, tout en respectant les droits fondamentaux des personnes, en particulier le droit à la protection des données à caractère personnel. À cet effet, il convient de créer un portail de recherche européen (ESP), un service partagé d’établissement de correspondances biométriques (#BMS partagé), un répertoire commun de données d’identité (#CIR) et un détecteur d’identités multiples (#MID) en tant qu’éléments d’interopérabilité.

      http://www.europeanmigrationlaw.eu/fr/articles/actualites/bases-de-donnees-interoperabilite-reglement-ue-2019817-frontier

  • #métaliste (qui va être un grand chantier, car il y a plein d’information sur seenthis, qu’il faudrait réorganiser) sur :
    #externalisation #contrôles_frontaliers #frontières #migrations #réfugiés

    Des liens vers des articles généraux sur l’externalisation des frontières de la part de l’ #UE (#EU) :
    https://seenthis.net/messages/569305
    https://seenthis.net/messages/390549
    https://seenthis.net/messages/320101

    Ici une tentative (très mal réussie, car évidement, la divergence entre pratiques et les discours à un moment donné, ça se voit !) de l’UE de faire une brochure pour déconstruire les mythes autour de la migration...
    La question de l’externalisation y est abordée dans différentes parties de la brochure :
    https://seenthis.net/messages/765967

    Petit chapitre/encadré sur l’externalisation des frontières dans l’ouvrage "(Dé)passer la frontière" :
    https://seenthis.net/messages/769367

    Les origines de l’externalisation des contrôles frontaliers (maritimes) : accord #USA-#Haïti de #1981 :
    https://seenthis.net/messages/768694

    L’externalisation des politiques européennes en matière de migration
    https://seenthis.net/messages/787450

    "#Sous-traitance" de la #politique_migratoire en Afrique : l’Europe a-t-elle les mains propres ?
    https://seenthis.net/messages/789048

    Partners in crime ? The impacts of Europe’s outsourced migration controls on peace, stability and rights :
    https://seenthis.net/messages/794636
    #paix #stabilité #droits #Libye #Niger #Turquie

    Proceedings of the conference “Externalisation of borders : detention practices and denial of the right to asylum”
    https://seenthis.net/messages/880193

    Brochure sur l’externalisation des frontières (passamontagna)
    https://seenthis.net/messages/952016