

Data visualizations for text: How to show the process of writing
▻https://hackernoon.com/data-visualizations-for-text-how-to-show-the-process-of-writing-c3221fad
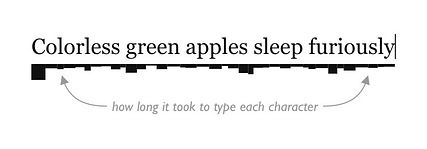
Data visualizations for text: How to show the process of writing with the writing graphScroll to the bottom of this story for a link to the original post.TEXT EDITORS (and the files they work) reveal surprisingly little about the history of editing. If you’re lucky, you get revisions to browse, and if not, you get undo/redo buttons. By adding temporal metadata to files, apps can display more than just the product — they can show process. This post introduces the writing graph, a timeline for viewing editing activity. A proof of concept below shows how new media artists, reflective writers and even casual readers can use this text visualization to learn more about what they’re reading.THE HISTORY OF MANIPULATING TEXT is rich with innovation (e.g., water-soluble cave paint, clay tablets, (...)
