

OneGeology Portal
▻http://portal.onegeology.org
un annuaire de couches wms autour de la géologie (pour le papa de @fil)
#map #wms #geodiversite
OneGeology Portal
▻http://portal.onegeology.org
un annuaire de couches wms autour de la géologie (pour le papa de @fil)
#map #wms #geodiversite
Exemple d’utilisation avec #leaflet :
▻http://tiles.kupaia.fr/article12.html
Le plus difficile aura été de trouver une couche de fond qui corresponde au système de coordonnées des couches géologiques... Il semble que pas mal de serveur WMS utilisent un autre système que celui annoncé dans une requête getcapabilities. Du coup il faut jouer aux devinettes pour réussir à exploiteur leur contenu => #fail
mapmatters.org
▻http://www.mapmatters.org
You will find an extensive catalogue of OGC web map services (WMS) here. For all services and WMS layers we offer an optional monitoring that allows to judge not only the contents but also the quality of the service with respect to availability and performance.


Most of these data sets are presented under very unclear licensing terms. The license should be shown prominently : it is often the most important metadata - the one that decides whether we can work with that data at all.
Simply because saddly most of the wms servers doesn’t provide the license information in a getcapabilities request. This information is optionnal as said in wms specs : ▻http://cite.opengeospatial.org/OGCTestData/wms/1.1.1/spec/wms1.1.1.html#wmsops.getcapabilities.response
Et hop, un exemple d’utilisation des couches #wms du #BRGM :
▻http://tiles.kupaia.fr/article11.html
Ici j’utilise Proj4Leaflet (▻https://github.com/kartena/Proj4Leaflet) pour gérer les systèmes de projections chelous utilisés par les différents services.
PS : c’est vraiment parfois super galère de trouver les infos sur les couches dispos (quel crs est utilisé, etc.).
domoritz/leaflet-maskcanvas · GitHub
▻https://github.com/domoritz/leaflet-maskcanvas
A leaflet canvas layer for displaying large coverage data sets.
Features: Canvas tile layer based / High performance even for large dataset because of the QuadTree that is used internally / Custom color and circle size
ISS Photo Locations
▻http://natronics.github.com/ISS-photo-locations
Since the first mission to the International Space Station over 12 years ago there have been over a million photographs taken by astronauts looking out from four hundred kilometers above Earth. Nearly all of them have been archived on NASA’s servers. I’ve crawled that archive, pulling down the location for each of the 1,129,177 photographs taken from the ISS1.
If we draw a dot for the location of every photo of Earth taken from space what do we see?
▻http://natronics.github.com/ISS-photo-locations/all_iss.preview.png
tmcw/togeojson · GitHub
▻https://github.com/tmcw/togeojson
This converts KML into GeoJSON, in a browser or with nodejs.
Peut être une piste pour gérer les kmls dans #GIS pour #SPIP à la place du plugin utilisé pour l’instant...
via ►http://macwright.org/2013/04/01/recently.html
#map #geojson #kml #javascript
tmcw/leaflet-pip · GitHub
▻https://github.com/tmcw/leaflet-pip
A Leaflet-friendly API for point in polygon operations, using substack’s point in polygon library.

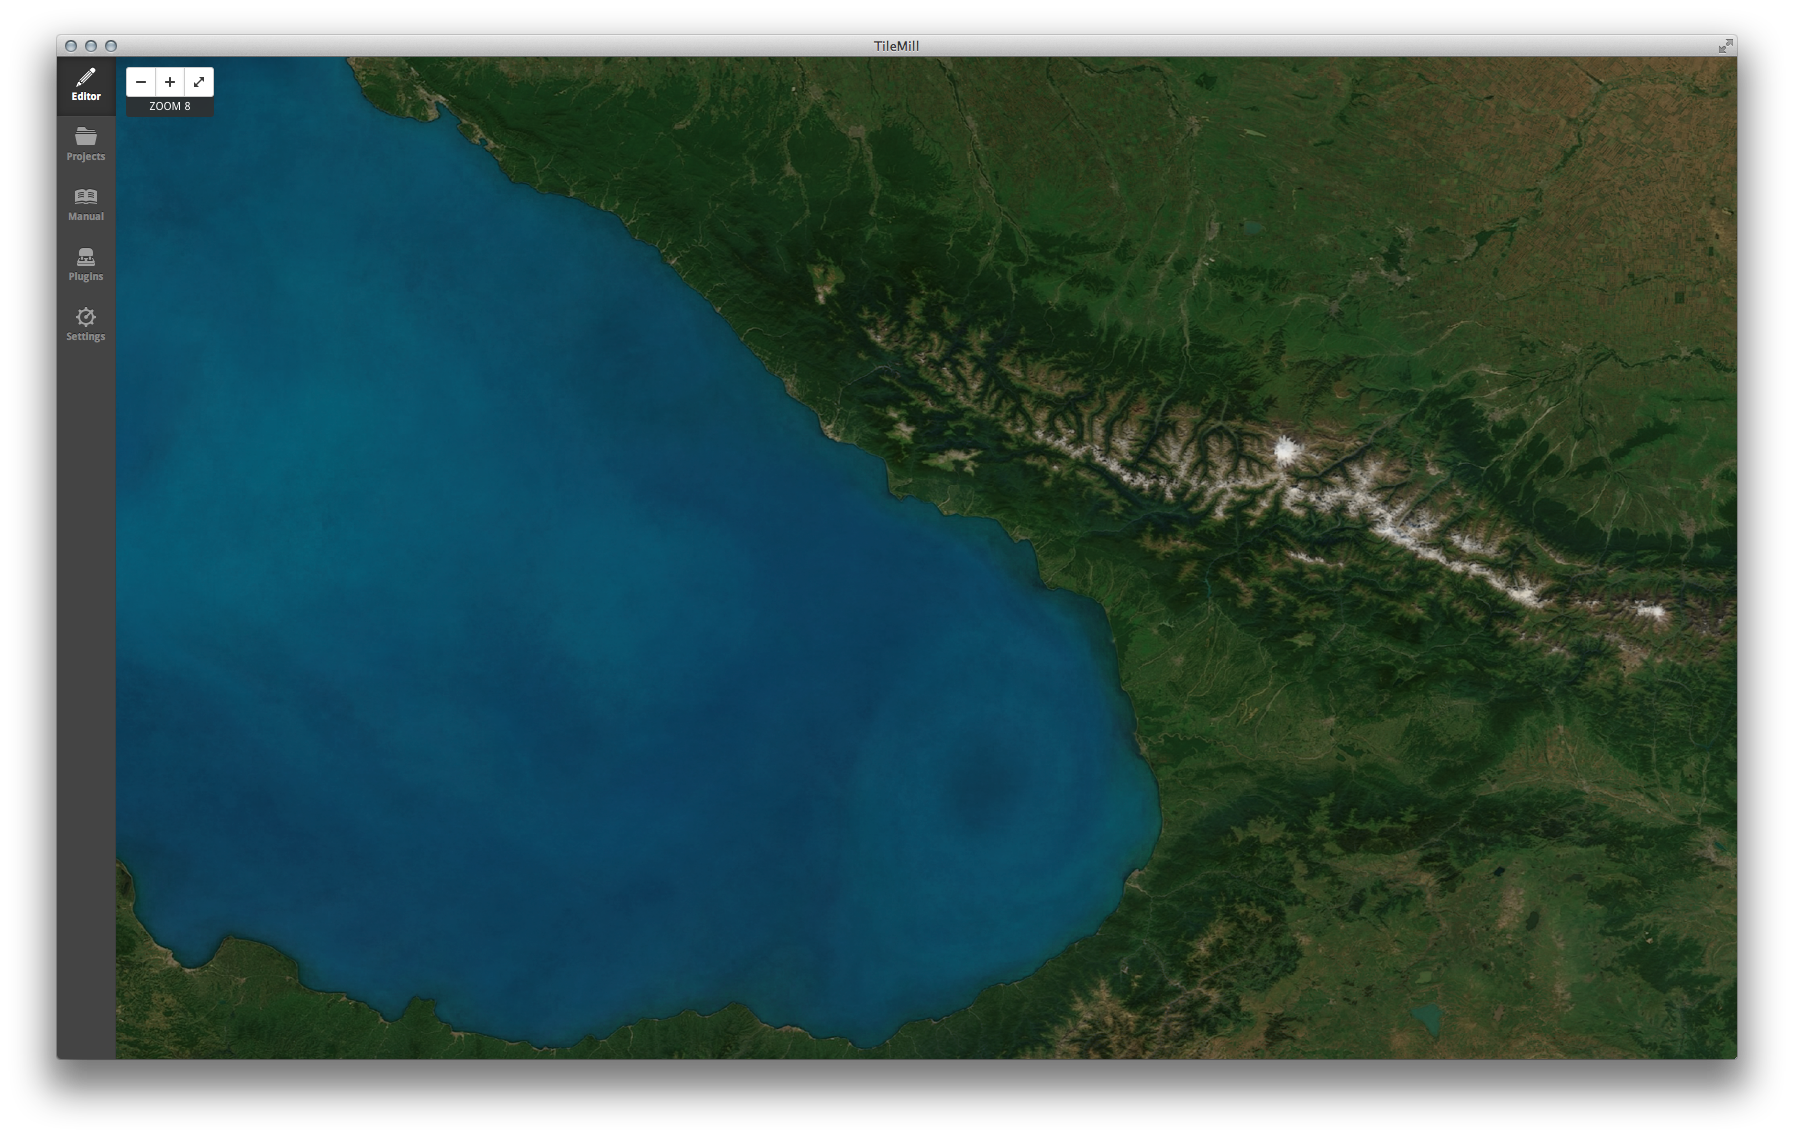
Making Clouds Go Away on #MapBox #Satellite | MapBox
▻http://mapbox.com/blog/improving-mapbox-satellite-by-making-clouds-disappear
We’ve been working on code that takes many years of images at once, looks at individual pixels instead of large regions, and outputs the average of all their clearest days. I could talk your ear off about the technical details, but the upshot is simple – we get cloudless images without seams!

#beau temps permanent :)
stamen design | Announcing here.stamen.com
▻http://content.stamen.com/here.stamen.com
“The exercise started with some code that our friend and former colleague Mike Migurski started playing with about a year ago to extract HERE data from their 3D tiles.”
On s’amuse chez stamen...
DATA.SHOM.FR
▻http://data.shom.fr
Un outil du SHOM qui permet de visualiser pas mal de données carto maritimes (reste à voir quelles couches sont dispos en open pour jouer avec dans nos cartes). Dommage d’utiliser un truc en flash pour ça par contre...
EuroGlobalMap | EuroGeographics
▻http://www.eurogeographics.org/products-and-services/euroglobalmap
EuroGlobalMap is a 1:1 million scale topographic dataset covering 45 countries and territories in the European region. It is now available as opendata. The dataset contains six themes : Administrative boundaries, The water network, Tranport networks, Settlements, Elevation, Names locations.
Et le lien direct pour le download : ▻http://www.eurogeographics.org/content/euroglobalmap-opendata
the liberty of postgreslessness: tiled vectors in mapnik (tecznotes)
▻http://mike.teczno.com/notes/postgreslessness-mapnik-vectiles.html
Data is one of OpenStreetMap’s biggest pain points. The latest planet file is 27GB, and getting OSM into the Postgres database can be a long and winding road. Vectored tiles offer a way forward, and Mapnik is growing features to support them. I’m also thinking about how vectors could be used with Mapnik directly to render bitmaps without needing direct access to a spatial data base. MVT (Mapnik Vector Tiles) is my first attempt at a sensible file format.
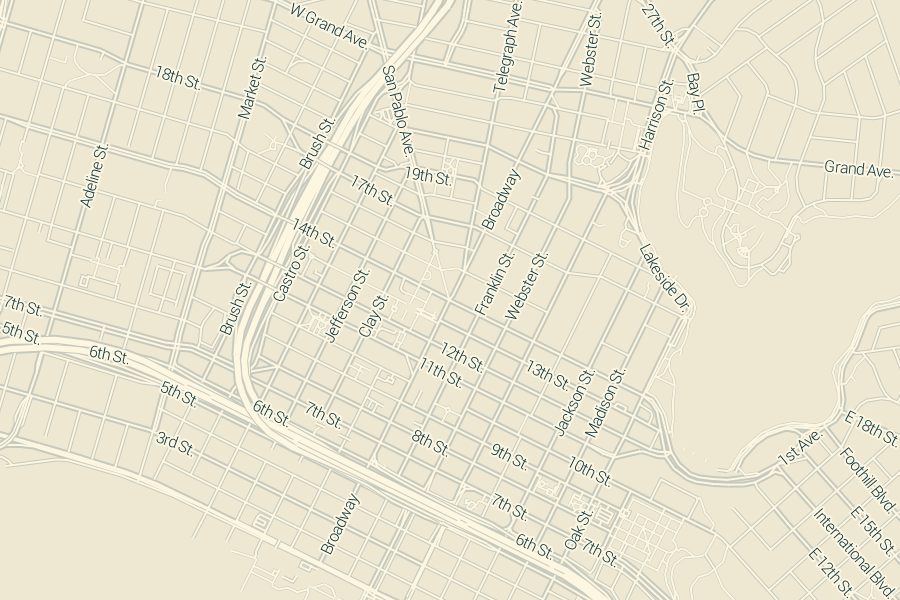
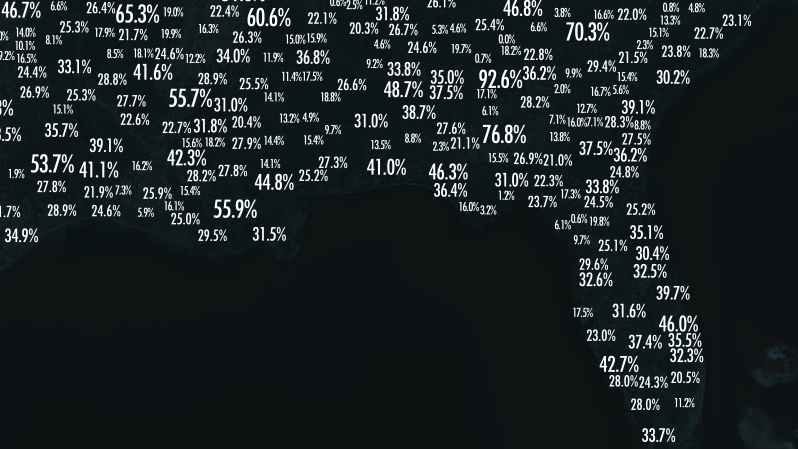
Scaled Data Value Design in TileMill | MapBox
▻http://mapbox.com/blog/scaled-data-value-design-in-tilemill
Scaled data values can ensure that a user’s eyes are drawn to important data points rather than geographical anomalies associated with many choropleth maps,
humangeo/leaflet-dvf · GitHub
▻https://github.com/humangeo/leaflet-dvf
Leaflet Data Visualization Framework (DVF) - The Leaflet DVF is an extension to CloudMade’s Leaflet JavaScript mapping library. The primary goal of the framework is to simplify data visualization and thematic mapping.
wavded/js-shapefile-to-geojson · GitHub
▻https://github.com/wavded/js-shapefile-to-geojson
Convert Shapfiles and DBF to GeoJSON using JavaScript
GeoSprocket Community Jive: Context For Cheap - The Map Reference Overlay
▻http://geosprocket.blogspot.fr/2013/01/context-for-cheap-map-reference-overlay.html
After I recovered the pieces of my brain that had exploded out my ears (maybe I’m easily impressed), I set to applying this tactic to my own maps. I also realized that this could be expanded to allow for a sort of map sandwich, with land and water below, thematic data next and reference data on top.
Atlas of European values - ▻http://www.atlasofeuropeanvalues.eu/new/europa-regio2.php #maps #europe #opinions
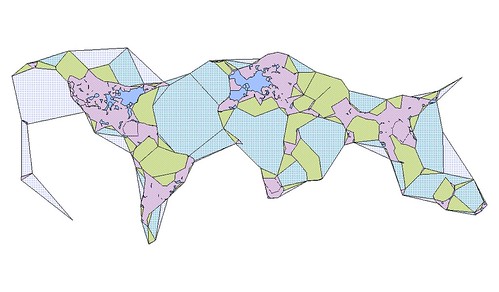
Home · mbostock/topojson Wiki
▻https://github.com/mbostock/topojson/wiki
TopoJSON is an extension of GeoJSON that encodes topology. A single TopoJSON file can contain multiple feature collections without duplication, such as states and counties. Or, a TopoJSON file can efficiently represent both polygons (for fill) and boundaries (for stroke) as two feature collections that share the same arc mesh.
As a result, TopoJSON is substantially more compact than GeoJSON. The above shapefile of U.S. counties is 2.2M as a GeoJSON file, but only 436K as a boundary mesh, a reduction of 80.4% even without simplification. TopoJSON can also be more efficient to render since shared control points need only be projected once. To further reduce file size, TopoJSON uses fixed-precision delta-encoding for integer coordinates rather than floats. This eliminates the need to round the precision of coordinate values (e.g., LilJSON), without sacrificing accuracy. Like GeoJSON, TopoJSON files are easily modified in a text editor and amenable to gzip compression.
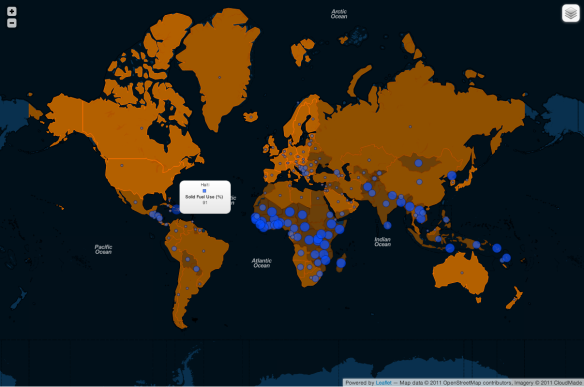
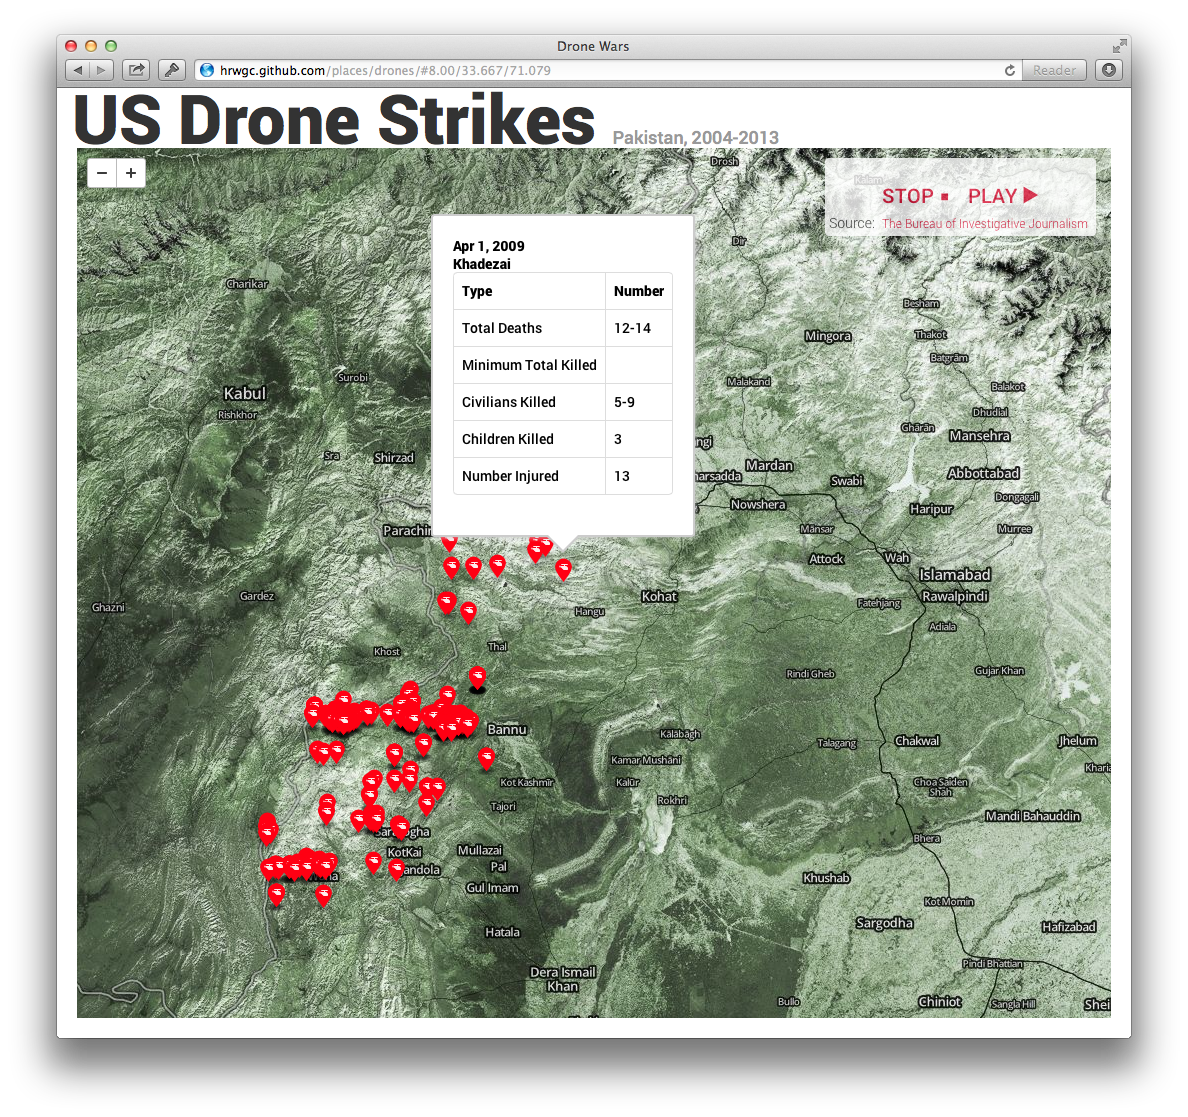
Using #Google_Fusion Tables to Add Real-Time Feeds to MapBox Maps | #MapBox
▻http://mapbox.com/blog/mapbox-fusion-tables-drones
toutes les explications techniques pour faire une carte comme celle-ci :
The Obama Administration has been the subject of much attention for the use of armed drones and targeted killings as part of its international counterterrorism efforts, and for the Administration’s extreme secrecy surrounding the practices. The Bureau of Investigative Journalism provides a live-updated database of U.S. covert drone strikes in Pakistan.

[ Musimap.com : : Spatialisez votre discographie ! ]
►http://www.musimap.com
►http://www.musimap.com/skins/default/images/homepage_sphere.png
Une app et un site pour découvrir la musique sous forme de cartes et de frises interactives.
►http://www.youtube.com/watch?feature=player_embedded&v=uzvIhXJkDjk
#Maps are a platform and a cost center that provides very little differentiation and negligible revenue: ►http://www.technologyspectator.com.au/burning-money-map-apps - just like an operating system... No wonder #Openstreetmap is on a linux-like trajectory.
Tinting #MapBox #Satellite
►http://mapbox.com/blog/video-tinting-mapbox-satellite
Last month we announced MapBox Satellite, a global high-resolution aerial imagery layer for MapBox Streets, our street-level map of the world. Through MapBox.com you can customize satellite maps to change their color hue and saturation, as well as overlay streets, labels, and boundaries on them.

#ImageMagick convert -crop
►http://www.imagemagick.org/Usage/crop/#crop_tile
convert rose: -crop 20x20 \
-set filename:tile „%[fx:page.x/20+1]%[fx:page.y/20+1]” \
+repage +adjoin „rose_tile%[filename:tile].gif”
#leaflet #cartographie #images pour un projet artistique de @mad_meg
https://dl.dropbox.com/s/lg4vbkmvax4ba97/tile_18_17.png
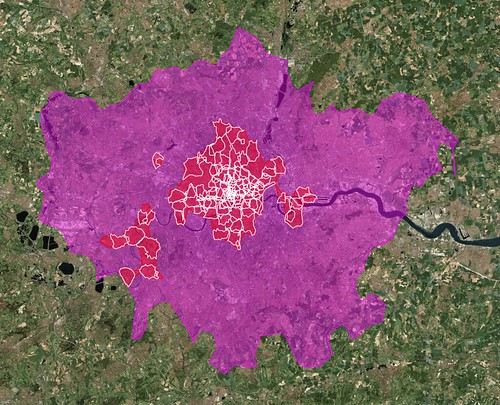
straup/Clustr
►https://github.com/straup/Clustr#readme
Clustr takes a text file containing longitude/latitude points, tagged with a bit of text, and attempts to generate minimal polygons that “cover” those points, using an “alpha” parameter to determine the notion of “coverage”. The polygons are written to an ESRI Shapefile, suitable for use in GIS software.
T’as un exemple visuel quelque part ? Je pense avoir compris le principe mais pas trop. :)
(#gis, pas qgis)
Ordnance Survey Blog » The evolution of Ordnance Survey mapping
►http://blog.ordnancesurvey.co.uk/2012/11/the-evolution-of-ordnance-survey-mapping
Alicja chose an area in the Lake District after searching through archives to identify an area that would perfectly show the evolution of maps over 200 years. There were a variety of examples across the years in the same scale (1 inch to 1 mile which evolved into what is today the highly recognisable 1:50 000 OS Landranger Map). The extract includes a number of different physical features to illustrate the changes over the decades – with mountains, lakes, vegetation and roads depicted.
#map #design #inspiration
Norkart/Leaflet-MiniMap
►https://github.com/Norkart/Leaflet-MiniMap
Leaflet.MiniMap is a simple minimap control that you can drop into your leaflet map, and it will create a small map in the corner which shows the same as the main map with a set zoom offset.
►http://norkart.github.com/Leaflet-MiniMap/example.html
Un truc qui manquait à leaflet maintenant dispo en plugin. Reste plus qu’à l’intégrer dans le plugin GIS pour SPIP.


