-
-
-
▻https://www.mediawiki.org/wiki/Maps
The maps project aims to build cartography technologies for all #Wikimedia projects, at a scale sufficient for their widespread usage.
The production maps cluster (See also on Wikitech) is in development by the WMF Discovery team. The implementation has various components including:
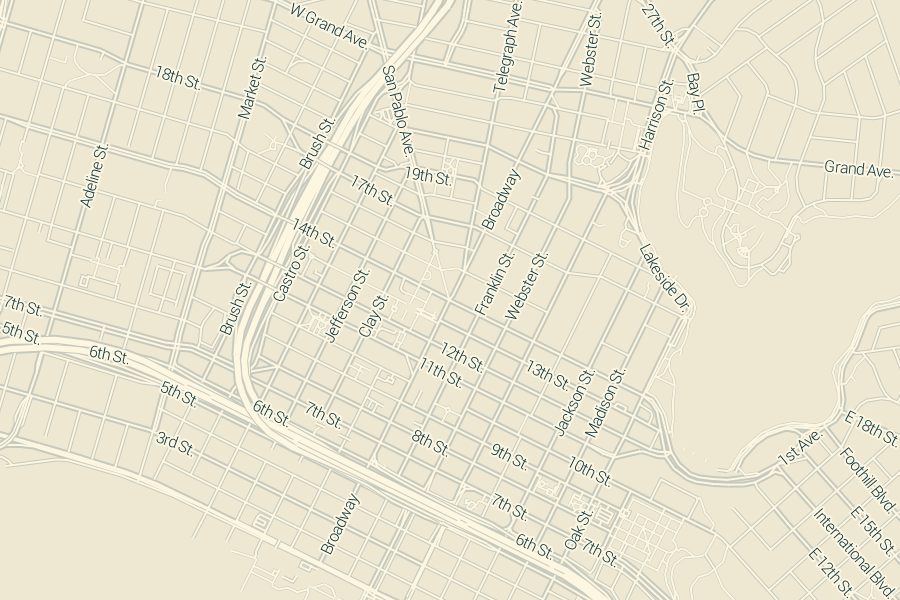
– #Kartotherian Github (primary) / Gerrit (mirror) - a server capable of providing #map #tiles in #vector (pbf) or raster (png) formats, as well as #static_map snapshots of any size for a given location.
– Tilerator Github (primary) / Gerrit (mirror) – a distributed backend tile generation service with a jobque
– A flexible sources system to set up the needed storage and processing pipelineA version of the tile server is now in operation at maps.wikimedia.org.
– It serves tiles at URLs such as
(bitmap) or …/791.json (OSM data – waterways, roads, place labels, etc.).
– It can scale images for the high-DPI devices – e.g. 1.5x, 2x, etc …/791@1.3x.png
– It can provide static maps with a given size and scaling, e.g.Kartotherian - OpenStreetMap Wiki
▻http://wiki.openstreetmap.org/wiki/Kartotherian
Kartotherian is a vector tile server based on open-source Mapbox stack, developed by Wikimedia Foundation for use on Wikipedia. It is horizontally scalable and designed for high loads.
Architecture
Kartotherian is a set of 3 services:
– Kartotherian - tile server itself.
– Tilerator - tile rendering queue.
– Tilerator-UI (optional) - UI for issuing commands to Tilerator.While Kartotherian can be configured to generate tiles on the fly straight from PostgreSQL, this is intended for development use only and the main mode of operation is to convert vector tiles generated by Tilerator into whatever user-requested format. An HTTP cache such as Varnish is recommended for reducing load on Kartotherian.
-
five-minute #geocoder for openaddresses (tecznotes)
▻http://mike.teczno.com/notes/openaddr/5min-geocoder.htmlStart with a clean server running a current version of #ubuntu LTS (long-term support); either 14.04 or 16.04 will work. Amazon has readymade Ubuntu images available on EC2, or a local copy running under Virtualbox will do for testing. Both the address import process and the Elasticsearch index are hungry for lots of memory, so pick a server with 4-8GB of memory to prevent failures.
-
OpenTileServer | OpenStreetMap Server Script
▻http://opentileserver.orgmapfig have created a new project OpenTileServer, which provides an installation script to set up an #osm tile server on an Ubuntu Linux system in a very easy way – think “switch2osm” but without the editing. Users choose what data to load, and whether they want OSM’s “standard” map style or “OSM bright”. Example OpenLayers and Leaflet pages are also included.
-
Wow, j’étais passé à côté de cette nouvelle fonctionnalité de #TileStache !
▻https://github.com/TileStache/TileStache/pull/204
New optional Layer parameter:
pixel effect
Optional dictionary that defines an effect to be applied for all tiles of this layer. Pixel effect can be any of these:blackwhite,greyscale,desaturate,pixelate,halftone, orblur. https://cloud.githubusercontent.com/assets/1008637/5132973/f5b1f812-70b5-11e4-9e98-f5b581852029.png
  https://cloud.githubusercontent.com/assets/1008637/5132992/21470eb8-70b6-11e4-941d-dd5c7ffcc214.png
  https://cloud.githubusercontent.com/assets/1008637/5132994/2bee4db8-70b6-11e4-8f2b-cc810d3e1350.png
  https://cloud.githubusercontent.com/assets/1008637/5132998/34e459f8-70b6-11e4-99a5-0bc704726214.png
  https://cloud.githubusercontent.com/assets/1008637/5133002/395e0ace-70b6-11e4-902d-b9249ba089b2.png
  https://cloud.githubusercontent.com/assets/1008637/5133004/3e205224-70b6-11e4-9f1e-120ccd83475c.png
  https://cloud.githubusercontent.com/assets/1008637/5133008/48d88aec-70b6-11e4-9527-8d51b5cd2cac.png
 -
-
GIS without GIS Servers
▻http://www.spatiallyadjusted.com/2014/09/08/gis-without-gis-serversMy bandmate, Sheldon McGee, and I presented at AGIC 2014 on how to serve up vector data in Google Maps without using some crazy GIS Server type software. Just a little node.js and some #PostGIS is all one needs.
-
Stop and Frisk
▻http://chrisherwig.org/tilehubtilehub - #mbtiles hosted and served via GitHub
▻https://github-camo.global.ssl.fastly.net/ba43014a17e54ad9aac668f78bb6a76de4d45296/68747470733a2f2f696d672e736b697463682e636f6d2f3230313
This project was inspired by Bobby Sudekum’s TileMill without the Box. Making a few simple modifications to his code, I was able to create tilehub, which serves #map tiles rendered in TileMill via GitHub pages. Everything is contained in (...)
-

A voir si GitHub se transforme en hébergeur web grand public (voir aussi ▻http://pages.github.com), on dirait que tout est fait pour...
Au lieu de maintenir un serveur, ou de s’embêter avec un FTP ou SSH, on peut versionner ses pages web avec git, et même les éditer directement dans Github.
-


@severo Ce n’est pas déconnant. Il ne faut pas oublier que git est orienté contenu. D’ailleurs, c’est déjà le cas ►http://octopress.org
Octopress is a framework designed by Brandon Mathis for Jekyll, the blog aware static site generator powering Github Pages. To start blogging with Jekyll, you have to write your own HTML templates, CSS, Javascripts and set up your configuration. But with Octopress All of that is already taken care of. Simply clone or fork Octopress, install dependencies and the theme, and you’re set.
-
-
ericfischer/datamaps · GitHub
▻https://github.com/ericfischer/datamapsThis is a tool for indexing large lists of geographic points or lines and dynamically generating #map #tiles from the index for display.
-

J’ai pas tout compris mais ça a l’air cool. :)
Ça génère une suite de fichiers de tuiles = un « fond de carte » à plusieurs niveaux de zoom ?
D’ailleurs ça génère dans quel format, et y-a-t-il un ou plusieurs formats standards pour ça ? J’ai toujours l’impression qu’il y a des milliers de formats, impossible à retenir, entre les formats de points/lignes, les formats de fond de carte, les serveurs de fonds, etc etc.
Un jour j’aimerais faire un schéma récapitulatif de tout ça....
-
Oui, l’outil permet de générer les tuiles qui représentent les données du fichier source :
cat file | ./encode -o directoryname -z 16
to encode them into a sorted quadtree in web Mercator in a new directory named directoryname, with enough bits to address individual pixels at zoom level 16.
Pour le format c’est du png...
-
j’ai l’impression qu’il manque la possibilité de choisir le style des points, tout a l’air d’être codé en dur. Mapserver propose les .map, et Geoserver les .sld, pour définir les styles, ici rien de tel on dirait. L’outil a l’air d’être surtout fait pour traiter des énormes quantités de points, et faire des « clusters » (montrer un seul point même s’il y en a 100 qui se superposent).
-
-
Inkscape and MapBox for Interactive, Illustrated maps | MapBox
▻http://www.mapbox.com/blog/the-making-of-our-infrastructure-mapI ran this shell script, which automatically assembled the PNG tiles into an #mbtiles file.
Intéressant ce script pour générer un fichier mbtiles à partir d’une sérié d’#images.
-
Ces gens sont assez géniaux.
-

-

héhé @fil je pensais justement à un truc dans le style :
ton script + le script cité ici + tilestache + ▻http://tiles.kupaia.fr = de la boulette
-
Ouais, j’ai pensé exactement à la même chose, les gens.
-
ok je viens de lire la doc de mbtiles (▻http://www.mapbox.com/developers/mbtiles), et je vois que ça va m’aider à résoudre un autre problème, celui de l’internationalisation du dessin ; là j’ai traité le dessin en trois langues déjà, et on en projette plein d’autres… pour l’instant ça me fait 4000 images par langue, alors que la plupart des zones sont inchangées (les légendes à traduire sont sur 1% de la surface)…
-
bon voilà j’ai fait un fichier .mbtiles à partir de #mbutil.py, que j’ai dû forker pour le faire « compresser »…
▻https://github.com/Fil/mbutil/commit/a0b04d1315466fb68125028171621142757efa23(A noter, la compression de l’image ne me gagne que 0,3% d’espace. Mais quand je mettrai dans une même base toutes les langues, ça devrait augmenter très peu à chaque langue.)
-
la référence désormais, pour ce script, c’est Alpstein/mbutil ▻http://seenthis.net/messages/150126
-
-
the liberty of postgreslessness: tiled vectors in mapnik (tecznotes)
▻http://mike.teczno.com/notes/postgreslessness-mapnik-vectiles.htmlData is one of OpenStreetMap’s biggest pain points. The latest planet file is 27GB, and getting OSM into the Postgres database can be a long and winding road. Vectored tiles offer a way forward, and Mapnik is growing features to support them. I’m also thinking about how vectors could be used with Mapnik directly to render bitmaps without needing direct access to a spatial data base. MVT (Mapnik Vector Tiles) is my first attempt at a sensible file format.
-
nvkelso/geo-how-to
►https://github.com/nvkelso/geo-how-todes liens en vrac autour de la carto web
-
Il est maintenant possible d’utiliser des filtres graphiques dans #mapnik :
►http://mapnik.org/news/2012/04/26/image-filters
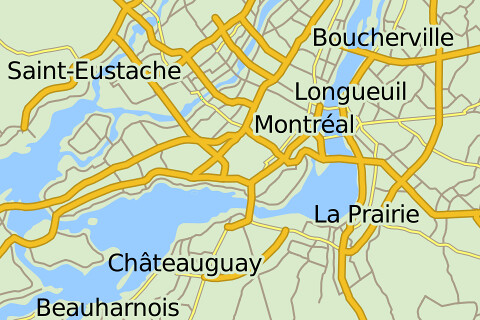
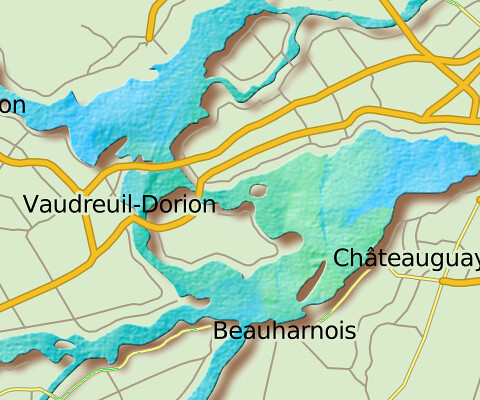
Une carte de base comme celle-ci :
Peut donner quelque chose de plus sympa comme ça :
Du coup, les gens de mapbox sont chaud pour utiliser tout ça dans #tilemill et ça donne envie :
-
Citytracking/toner @ GitHub
►http://citytracking.github.com/toner“Toner is the name of the map tiles, and Mapnik stylesheets, used for the Dotspotting project.”
Un set de styles mapnik pour générer des cartes en noir et blanc.
-
Ça faisait un moment que je voulais tester la mise en place d’un serveur de tuiles. Après avoir lu pas mal de pages à ce sujet j’ai choisi d’utiliser TileStache (développé par les gens de Stamen).
Ma collection de liens et commentaires en vrac sont ici : ►http://labo.eliaz.fr/spip.php?article97
Et comme je suis sympa, je vous ai rédigé un petit tutoriel pour installer TileStache sur votre serveur : ►http://www.weblog.eliaz.fr/article115.html
-

what the fuck @seenthis c’est quoi ce favicon attribué autofoireusement à mon site ? ^^
-

Et hop, mise à jour du tutoriel pour utiliser #python_virtualenv sur les conseils de @ybon :)
TileStache + virtualenv + mod_wsgi
Dans un précédent billet, j’expliquais comment installer TileStache sur Ubuntu Server 12.04. Le présent billet propose une autre méthode basée sur les environnements virtuels de Python.
-
-
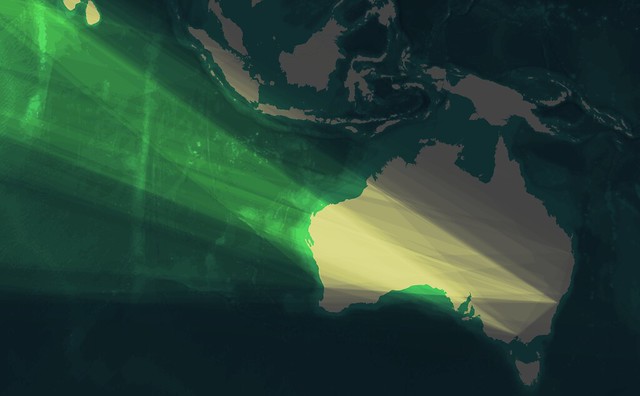
Interview : Mike Migurski - Paul Smith
►http://pauladamsmith.com/blog/2012/03/migurski.htmlInterview de Mike Migurski auteur de TilesTache et de la fameuse carte en watercolor qui a fait du bruit dernièrement. L’article comporte un lien vers une autre page ou le procédé de génération de la carte watercolor est détaillé.
-
-
-
et comment ils ont produit les textures
►http://content.stamen.com/watercolor_textures
-
-
Downloads | Natural Earth
►http://www.naturalearthdata.com/downloadsGlobal vector data at three different scales, optimized for rendering images of large regions, countries and continents, up to about zoom=9. Data themes are available in three levels of detail. For each scale, themes are listed on Cultural, Physical, and Raster category pages.