Second Languages
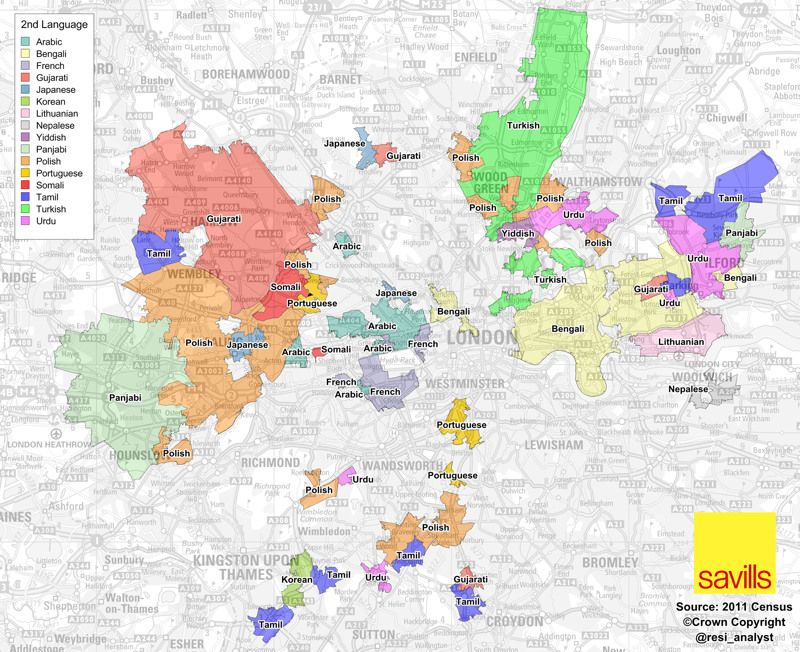
A map full of striking patterns, from Savills’ analyst Neal Hudson. It shows the areas of London where, for each area, the second most popular language is spoken by more than 5% of residents there, based on the 2011 Census. It clearly reveals London’s linguistic clusters, from Arabic to Yiddish and Lithuanian to Tamil.
The full-size map is no longer on Neal’s website but you can download it here.
Note that this is not a map of people’s own second languages, but rather of the second most popular language spoken in each area. The areas used are Middle Super Output Areas which have a typical population of around 10000 people, so, as a guide at least 500 people within each area speak the language shown as their primary language. Middle Super Output Areas are a statistical grouping of areas. They are somewhat analogous to political wards, except that they change if their populations decrease below, or increase above, thresholds, whereas wards tend to remain constant.
 http://mappinglondon.co.uk/wp-content/uploads/2013/06/londonsecond_lang_800.jpg
 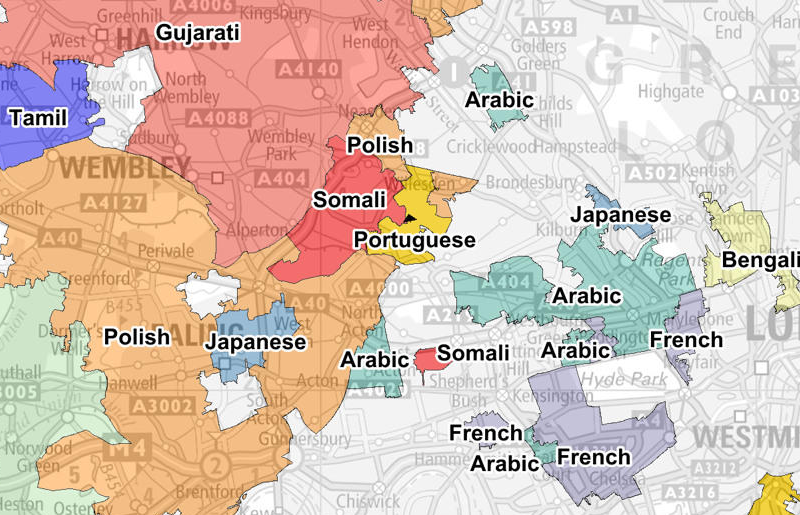 http://mappinglondon.co.uk/wp-content/uploads/2013/06/londonlang_detail.png
 #langue #visualisation #cartographie #carte #Londres
▻http://mappinglondon.co.uk/2013/second-languages
cc @reka