How to make infographics: a beginner’s guide to data visualisation | Global Development Professionals Network | The Guardian
As a growing number of international NGOs are using infographics, charts and interactive maps to share success and highlight disaster, how can organisations with less resources create high quality visualisations without having to pay to outsource them?
We’ve put together a beginner’s guide for visualising development data.
Organising your data
▻http://www.theguardian.com/global-development-professionals-network/2014/aug/28/interactive-infographics-development-data
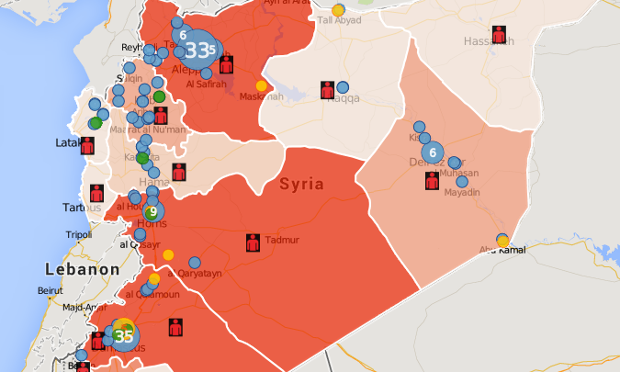
The first thing you need to do is have a clear idea of the data you want to visualise. Are you trying to highlight a particular disparity between money spent in one place and another? Are you trying to show a volume of activity going on in one location?