
Gesammelte bildpädagogische Schriften", herausgegeben von Rudolf Haller und Robin Kinross, Verlag Hölder Pichler Tempsky, Wien 1991, ISBN 3-209-00863-9
#bibliographie #livre #otto-neurath #isotype #visualisation #cartographie
Gesammelte bildpädagogische Schriften", herausgegeben von Rudolf Haller und Robin Kinross, Verlag Hölder Pichler Tempsky, Wien 1991, ISBN 3-209-00863-9
#bibliographie #livre #otto-neurath #isotype #visualisation #cartographie
Gesammelte bildpädagogische Schriften
▻http://www.buecher-nach-isbn.info/3-209/3209008639-Gesammelte-bildpaedagogische-Schriften-Otto-Neurath-3
Gesammelte bildpädagogische Schriften
von Otto Neurath
öbv, Firmensitz Wien · 1991
ISBN: 978-3-209-00863-3
#bibliographie #livre #otto-neurath #isotype #visualisation #cartographie
Publisher: Cambridge University Press, Cambridge, 2008
Philosophy Between Science and Politics.
A study of Neurath’s theory of science in its economic, political and social contexts.
ISBN 978-0521-45174-1
ISBN 978-0521-04111-9
#bibliographie #livre #otto-neurath #isotype #visualisation #cartographie
« The Neurath Principle : its Grounds and Consequences »
in Rediscovering the Forgotten Vienna Circle: Austrian Studies on Otto Neurath and the Vienna Circle, Kluwer Academic Publishers, Dordrecht
Thomas Ernst Uebel (ed.)
Kluwer Academic Publishers (1991)
#bibliographie #livre #isotype #otto-neurath #visualisation #cartographie
Arbeiterbildung in der Zwischenkriegszeit. Otto Neurath - Gerd Arntz. by Stadler, Friedrich; Neurath, Otto; Arntz, Gerd: Locker/ Osterrichisches Gesellschafts- Und Wirtschaftsmuseum, Wien
▻http://www.abebooks.co.uk/servlet/BookDetailsPL?bi=8732868455
Arbeiterbildung in der Zwischenkriegszeit. Otto Neurath - Gerd Arntz. (ISBN 10: 3900337055 / ISBN 13: 9783900337056 )
Stadler, Friedrich; Neurath, Otto; Arntz, Gerd
Title: Arbeiterbildung in der Zwischenkriegszeit. ...
Publisher: Locker/ Osterrichisches Gesellschafts- Und Wirtschaftsmuseum, Wien
Publication Date: 1982
Illustrator: Gerd Arntz
original pictorial wraps, in near fine condition. Profusely illustrated by photos, Isotype diagrams and Gerd Arntz’s artworks. pp 1-226 contains contributions from F. Stadler, Marie Neurath, Paul Neurath, R. Haller, G. Arntz, E. Nemeth et al on Neurath and Arntz, pp 227-461 illustrates the exhibition. rare. Bookseller Inventory # 001559
Locker/ Osterrichisches Gesellschafts- Und Wirtschaftsmuseum, Wien, 1982
original pictorial wraps, in near fine condition. Profusely illustrated by photos, Isotype diagrams and Gerd Arntz’s artworks. pp 1-226 contains contributions from F. Stadler, Marie Neurath, Paul Neurath, R. Haller, G. Arntz, E. Nemeth et al on Neurath and Arntz, pp 227-461 illustrates the exhibition. rare. (Otto Neurath, Gerd Arntz, Isotype)
#bibliographie #livre #isotype #otto-neurath #visualisation #cartographie
World: Humanitarian and Country Icons 2012 | ReliefWeb
▻http://reliefweb.int/map/world/world-humanitarian-and-country-icons-2012
OCHA adds 500 free humanitarian symbols to communications tools and services
https://dl.dropbox.com/s/rn5q8e2koc7mzao/unocha.png
▻http://thenounproject.com/collections/ocha-humanitarian-icons
The United Nations Office for the Coordination of Humanitarian affairs (OCHA) has created a set of 500 freely available humanitarian icons to help relief workers present emergency and crisis-related information quickly and simply.
When a disaster strikes, it is vital that the humanitarian community can gather reliable data on the locations and needs of affected people and who is best placed to assist them. This often involves the need to present complex information in a way that everyone can understand.
Le fichier pdf est téléchargeable ici (14 Mo) :
▻http://reliefweb.int/sites/reliefweb.int/files/resources/2012_OCHA_country_icons.pdf
7 mois après les avoir archivés, et retrouvés en 3 sec sur seenthis, je m’en suis servi...
Merci #seenthis
Otto Neurath
Isotype Revisited | Modern man in the making
▻http://isotyperevisited.org/2009/09/modern-man-in-the-making.html
Modern man in the making
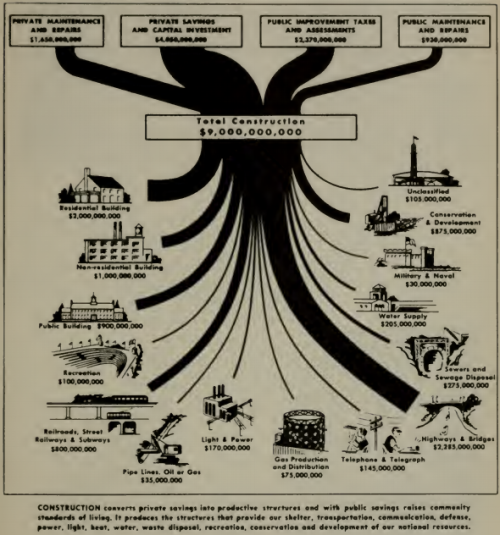
Modern man in the making (1939) is the high point of the Isotype team’s core concern with social statistics. It resulted from a generous commission by the publisher Alfred A. Knopf, which gave Otto Neurath great freedom as author of the book. His principal collaborator (and later wife) Marie Reidemeister persuaded him to try something new: a book in what she called ’picture-text’ style. A chart inserted into the text constituted a ’paragraph’ that had to be ’read’ in order to follow the argument. Reidemeister assumed the role of ’transformer’, a name coined for the interpreter of statistical data into simplified graphic form - a role that anticipated the modern information designer. She worked closely with Neurath and Gerd Arntz to produce the tight unity of the book. Seven colours in total were used for printing the graphics.
Graphic Presentation. Willard C. Brinton | thesis.armina
▻http://thesis.armina.info/node/147
Graphic Presentation. Willard C. Brinton
Fri, 21/08/2009
A beautiful set carefully collected by prof. Michael Stoll (Germany) shows some work of Willard C. Brinton (1880-1957), a chairman of comittee known as “Joint Committee on Standards for Graphic Presentation”. His first book “Graphic methods for presenting facts”, published in 1914, was the first American book on graphic techniques for business and general audience.
“Graphic Presentation”, shown in this set, is a second book of ingenieur Willard C. Brinton published by himself in New York, 1939. It is worth looking on many possible methods, from graphs to abstract visualizations. Many of them nowadays are still looking similar.
Willard C. Brinton
1939 Graphic Presentation Book | Sankey Diagrams
▻http://www.sankey-diagrams.com/1939-graphic-presentation-book
1939 Graphic Presentation Book
This post on the Visual Think Map blog (new addition to my blogroll) guided me to the fantastic 1939 book ‘Graphic Presentation’ by Willard C. Brinton. It is available in full as a PDF on archive.org.
The book with more than 50 chapters features literally hundreds of graphics…
#visualisation #infographie #information-design #otto-neurath #Willard-Brinton
Otto Neurath - référence bibliographique importante
Paul Stiff
Some documents for a history of information design
histor-of-inf-design.pdf
▻http://folk.uio.no/vidarp/histor-of-inf-design.pdf
This is a light revision of an illustrated talk designed for
and given at a meeting on ‘Information design histories’.
I have now added explanatory notes and bibliographical
references, and although I have severely cut the illustrations, the new appendix may go some way towards
satisfying people interested in the origins of the term ‘information design’. (The meeting was held at Coventry University, England, on 10 December 2003; it was organized by the Communication Research Institute of Australia and the Information Design Network at Coventry University.)
The two histories I had in mind as I planned this sketch
shared a common starting point. Information design had
barely been named before Robin Kinross explained its
genesis. In his argument of 1984
Otto Neurath - Référence bibliographique très importante
ZVAB.com: Arbeiterbildung in der Zwischenkriegszeit von Neurath,Otto Arntz,Gerd [ Herausgeber Friedrich Stadler ] - Löcker o.A. 1982 Wien - 3854090390 - Versandtbuchhandel - Bücher
▻http://www.zvab.com/displayBookDetails.do?itemId=215807949&b=1
Arbeiterbildung in der Zwischenkriegszeit - Neurath,Otto Arntz,Gerd [ Herausgeber Friedrich Stadler ]
Neurath,Otto Arntz,Gerd [ Herausgeber Friedrich Stadler ]
Arbeiterbildung in der Zwischenkriegszeit
[nach diesem Titel suchen]
Löcker o.A. 1982 Wien
ISBN 3854090390
Seiten: 463 Hardcover minimaler Fleck rechter Schnitt rückwärtiges Cover unten rechts minimal gestaucht gutes Exemplar selten
[Schlagwörter: Ausstellungskatalog/Soziologie]
Sprache: Deutsch
Artikel-Nr.: 1559
631 weitere Einträge gefunden im
Katalog Varia beim Anbieter Versandtbuchhandel, Deutschland
Der Anbieter weist keine Mehrwertsteuer aus (brutto = netto).

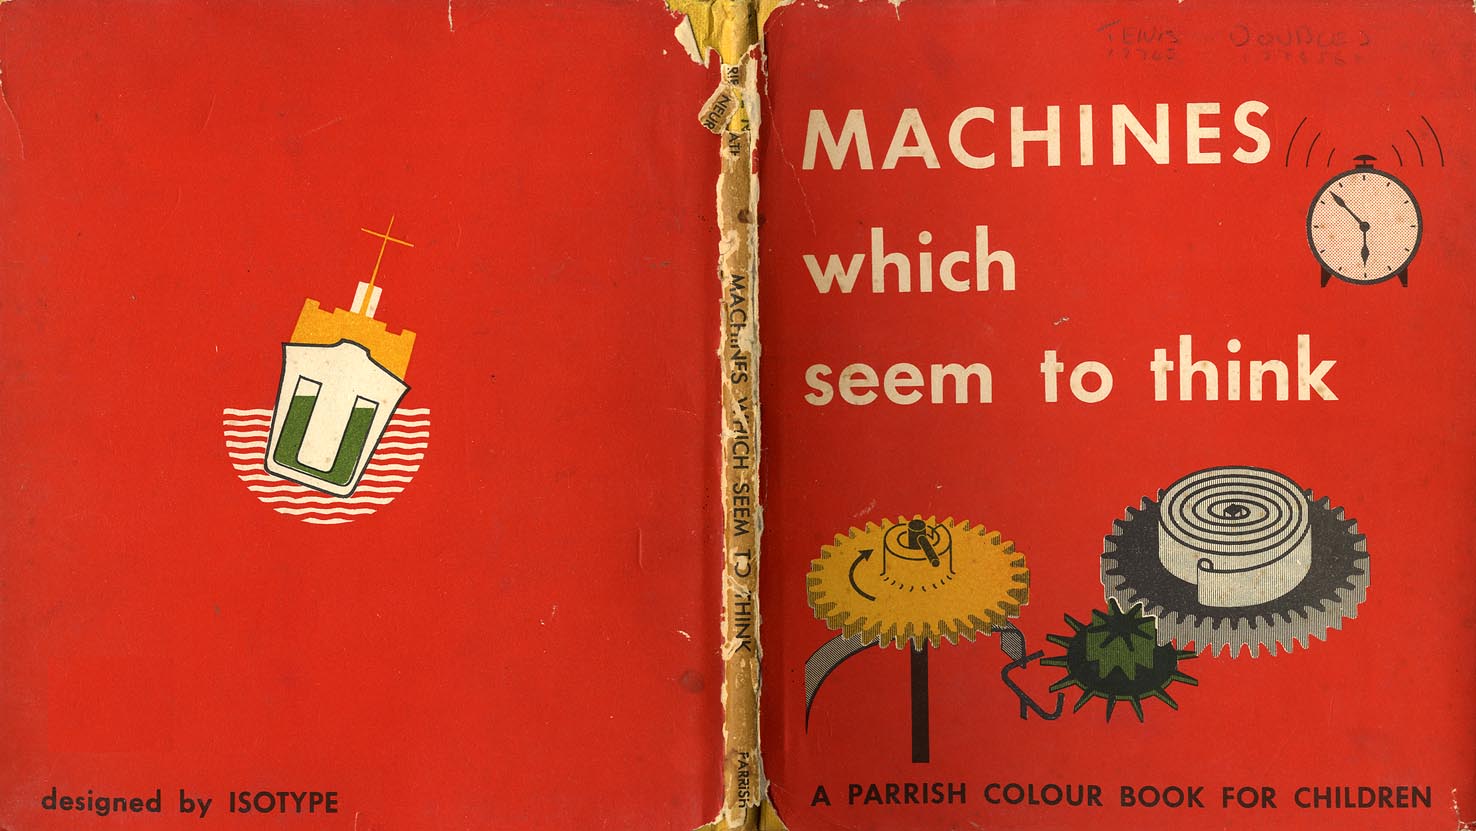
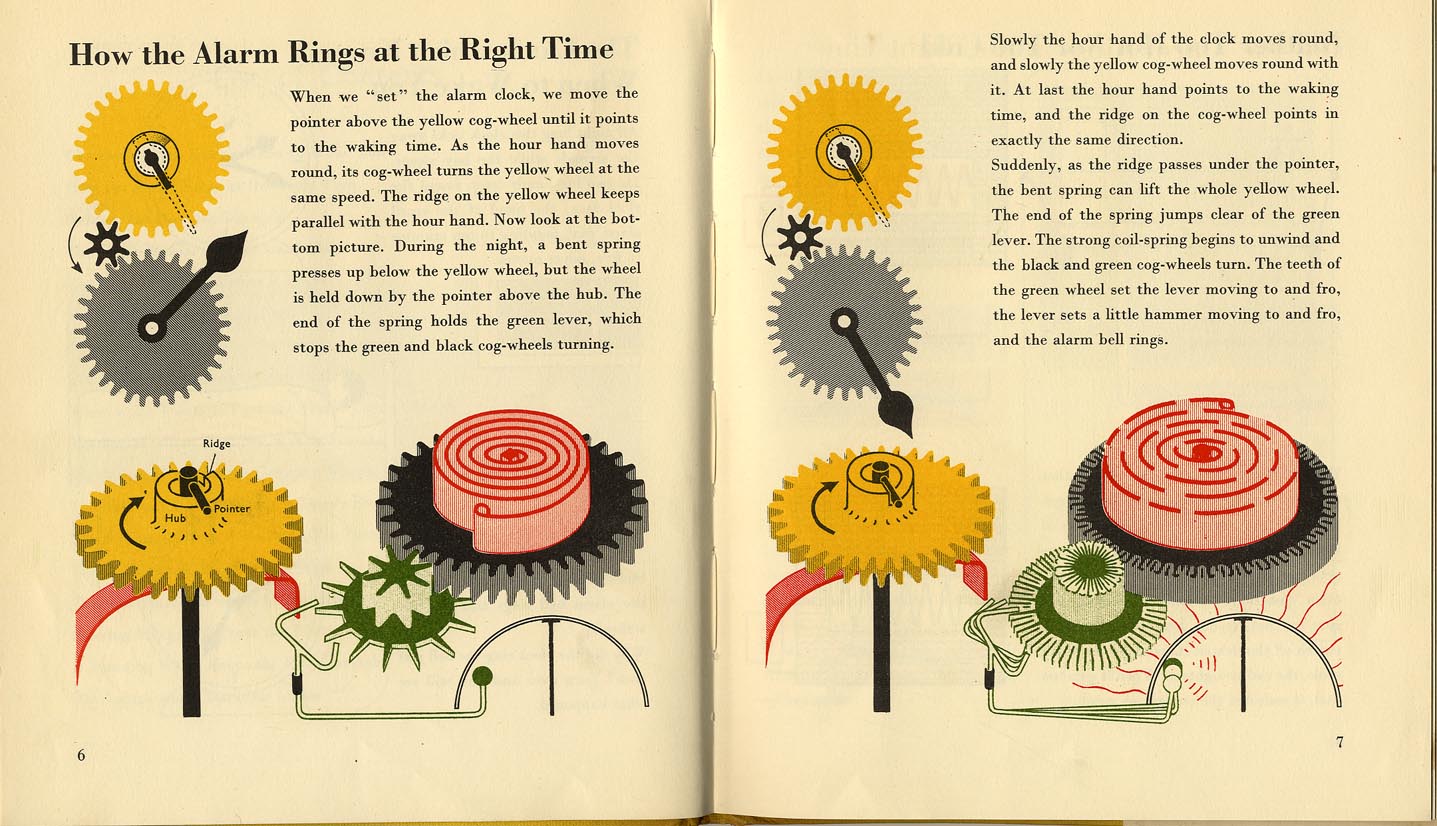
ISOTYPE, Machines which seem to think, 1953, Marie Neurath
▻http://www.fulltable.com/iso/mw.htm
#marie_neurath #automatisation
ce site montre une belle collection : ►http://www.fulltable.com/iso

Un bon bouquin qui vient de sortir aux éditions B42, Le Transformateur sur les principes de création des diagrammes Isotype, qui ont servi à donner une image visuelle à des informations statistique. Un langage visuel qui va bien au delà de la simple compilation de pictogrammes.
En effet superbe, je suis (très jaloux) d’être en Norvège et de ne pas pouvoir me précipiter pour l’acheter.
#visualisation #information-design #otto-Neurath marie-neurath

Une affiche ou un tract à la manière de #Gerd_Arntz pour dénoncer les effets odieux de l’#allocation des ressources par le mécanisme marchand, ici appliqué au #logement.
▻http://sia32.lautre.net/HousingLogement.pdf
Information design
Je ne suis pas sur de comment on pourrait traduire « Information design » en français, mais on peut le définir par "représentation visuelle [graphique] d’informations, de données qualitatives ou/et quantitatives".
La magazine d’architecture Arch + et la fondation Bauhaus à Dessau ont organisé un concours international doté de plus de 20 000 euros de prix :
« Out of balance - Critique of the present »
Information Design after Otto Neurath
« Déséquilibres (sociaux, économiques, politiques, environnementaux) - Un regard critique sur le monde contemporain »
A partir de ces thèmes généraux, 180 équipes de designers, ont envoyé une oeuvre graphique, infographique ou cartographique en quatre volets.
Ces oeuvres seront examinées à Berlin, à la Maison des cultures du monde (Haus der Kulturen der Welt) vendredi 1er mars 2013 par un jury international de 8 personnes venant d’Allemagne, des pays-Bas, de France, du Royaume-Uni, des Etats-Unis)
Intention
1. Inégalités, discriminations
Les évolutions sociales actuellement en cours montrent que les inégalités se creusent, et la mise en place de politiques sociales injustes sont en train de ravager des couches entières de la population. Selon le contexte socio-spatial, les chances de « réussite » dans la vie varient à l’extrême : c’est totalement aléatoire. Pourtant, la démocratie, l’état de droit est bâti sur le postulat de l’égalité des chances. Cette condition étant loin d’être remplie, il est nécessaire de se demander pourquoi, d’évaluer les conséquences d’un régime économique néolibéral qui dure depuis plus de 30 ans, les conséquences aussi de la privatisation, de la dérégulation et de la « restructuration » des systèmes sociaux, les conséquences enfin d’une activité financière et spéculative débridée sur les populations les plus démunies de la planète, système « d’irresponsabilité organisée » ayant précipité le monde dans sa crise la plus grave depuis un siècle
Pour la première fois dans l’histoire de l’humanité, plus de 50 % de la population mondiale vit en milieu urbain, dans lesquels par exemple les migrant espèrent une vie meilleure (mais ne trouvent souvent que discriminations et inégalité). Les grandes mégalopoles se transforment en ensembles ingérables où les conditions de vie se dégradent.
2. Un monde sur-informé et illisible
Ce n’est pas parce que nous n’avons pas assez d’informations que nous avons du mal à lire le monde, mais justement parce que nous en avons trop. Informations qui nous arrivent en masse et en vrac et brouille la lecture du monde. C’est une situation paradoxale ("opacité" digitale). Alors que cette masse de données, d’infos « libérée », « accessible » devrait nous permettre de voir et comprendre dans l’immédiateté, au contraire, elle nous aveugle et nous cache les grandes évolutions. Par conséquent, comment traiter cette information pléthorique de sorte qu’elle nous dise quelque chose, qu’elle nous montre, qu’elle nous suggère comment la société évolue ?
3. Représentation visuelle des données
Par la représentation visuelle, la cartographie, la représentation des données par l’image graphique (information design en anglais, qui est si difficile à traduire). D’ailleurs, c’est beaucoup plus qu’un regroupement de données, qu’une simple transformation des données en système graphique.
Cette conception graphique de l’information sert à exprimer une intention, à transmettre un message. Elle révèle des connexions, décrypte de systèmes, crée une hiérarchie pertinente, synthétise, réduit la complexité pour faire apparaître les tendances, les évolutions. Elle n’est pas neutre, elle est subjective, elle peut très bien être un engagement politique fort, elle peut et doit révéler l’invisible, les injustices, la discrimination, les inégalités, ce qui est oublié... Mais néanmoins indispensable pour comprendre notre temps.
Une représentation visuelle incisive et claire influence notre vision de la société, elle sculpte l’image que nous nous faisons du monde, et enfin elle déterminera la façon dont nous pouvons/pourrons/voudrons agir ...
Les thèmes sur lesquels les groupes candidats ont travaillé étaient les suivants :
– Processus de transformation urbaine (modernisation, bidonvillisation, ...)
– Phénomènes de ségrégation
– Pollutions
– Mouvement financiers, spéculation
– Dette
– circulation des marchandises et de matières premières
– externalisation des tâches de production
– Migrations humaines, déplacement de population
– Agriculture, faim, alimentation
–-----
Isotype Building Bridges | Humantific
▻http://www.humantific.com/isotype-building-bridges
These are from 1943.
In early Isotype studio work, one can find many great examples of sensemaking acceleration techniques that are still in use today, including the comparison. Experts in presenting complex subjects clearly, the Isotype Institute team often used comparisons to help explain differences and similarities between groups, regions, and countries.
Humantific
Founded in New York City in 2001 by Elizabeth Pastor and GK VanPatter, Humantific has evolved into a leading SenseMaking and ChangeMaking consultancy. For more than ten years we have been working with organizational leaders on challenges occurring at the intersection of SenseMaking and ChangeMaking. We have already learned alot!
Today, in the emerging social media/social economy era, we are seeing tremendous rising interest in the power of both Visual SenseMaking and CoCreated ChangeMaking. We see leaders in every country, in every industry, seeking to tap into and make sense of the tsunami of data/information that is crashing on their shores, as well as make sense of complex situations where no data exists. We see many leadership teams facing the need to design and then drive meaningful future-forward change in their organizations as the world around them is in continuous motion.
While others in the marketplace are using Big Data to drive eye-balls to web sites, and to sell more cornflakes, Humantific has since 2001 been focused on using Data and Information to solve real problems in organizations and in societies. We see data and information as FUEL for innovation. Helping leaders create innovative solutions to complex challenges is the real promise of Big Data from our perspective. That means we are not just using information to enhance decision-making (convergent thinking) but also to fuel idea-making (divergent thinking). Without both in orchestration no innovation occurs.
Lost Stories Information Design History | Humantific
▻http://www.humantific.com/lost-stories-information-design-history
Lost Stories Information Design History
ARCH+ - the Bauhaus Dessau Foundation
OUT OF BALANCE – CRITIQUE OF THE PRESENT
Berlin, 28 février - 1er Avril - 180 projets cartographiques attendent un jury, du public. Hommage à Otto Neurath et aux merveilleux membres fondateurs du Bauhaus
▻http://www.archplus.net/home/outofbalance_e
❝“At any rate, we must also show how the world really is.”
Otto Neurath
“There are always connections, you only have to want to find them.”
Umberto Eco
“The purpose of visualizations is insights, not pictures.”
Ben Shneiderman
International Competition
OUT OF BALANCE – CRITIQUE OF THE PRESENT. Information Design after Otto Neurath
of the Magazine ARCH+ and the Bauhaus Dessau Foundation
Britain vs. America in Minimalist Vintage Infographics | Brain Pickings
►http://www.brainpickings.org/index.php/2012/11/13/only-an-ocean-between-isotype-infographics
ISOTYPE, the vintage visual language pioneered by Austrian sociologist, philosopher and curator Otto Neurath and his wife Marie in the 1930s, shaped modern information graphics and visual storytelling. America and Britain: Three Volumes in One, also known as Only an Ocean Between, is a wonderful 1946 out-of-print book by P. Sargant Florence and Lella Secor Florence from the golden age of ISOTYPE, kindly digitized by Michael Stoll, presenting a series of minimalist infographics that compare and contrast various aspects of life in Britain and the United States, a-la Paris vs. New York.


