• La datation U-Th (Uranium-Thorium) des croûtes carbonatées révèle l’origine néandertalienne de l’art pariétal ibérique.

    http://science.sciencemag.org/content/359/6378/912.full

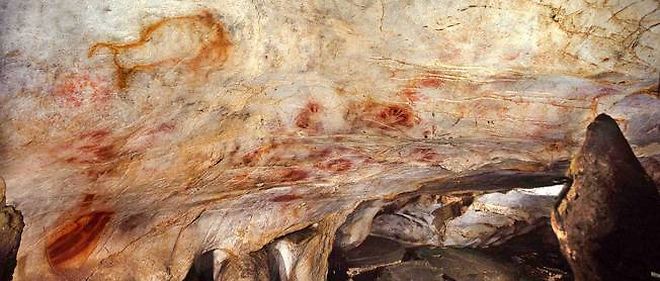
    L’étendue et la nature du comportement symbolique chez les Néandertaliens sont obscures. Bien que des preuves de l’ornementation du corps de Néandertal aient été proposées, toutes les peintures rupestres ont été attribuées aux humains modernes. Ici, nous présentons les résultats de datation pour trois sites en Espagne qui montrent que l’art rupestre a émergé en Ibérie sensiblement plus tôt que prévu. Les datations uranium-thorium (U-Th) sur des croûtes carbonatées recouvrent des âges minimums pour un motif linéaire rouge à La Pasiega (Cantabrie), un pochoir à main à Maltravieso (Estrémadure) et des spéléothèmes peints en rouge à Ardales (Andalousie). Collectivement, ces résultats montrent que l’art pariétal en Ibérie est âgé de plus de 64,8 mille ans (ka). Cet art rupestre est le plus ancien daté à ce jour et précède d’au moins 20 ka l’arrivée des humains modernes en Europe, ce qui implique la paternité de l’homme de Neandertal.

    L’étude détaillée :
    http://www.sciencemag.org/content/359/6378/912/suppl/DC1

    La réaction de certains préhistoriens qui souhaitent vraiment voir « la tête » de certains de leurs confrères opposés à ce que Néandertal soit capable de symbolisme , ici :
    http://science.sciencemag.org/content/359/6378/852.full

    Et plus, sérieusement, quelques doutes sur les possibles erreurs de datations car l’uranium aurait pu être lessivé #Ludovic_Slimak #cnrs #Michel_Fontugne #Laboratoire_des_sciences_du_climat_et_de_l'environnement
    http://www.lemonde.fr/sciences/article/2018/02/22/neandertal-est-il-le-premier-auteur-de-peintures-rupestres_5261139_1650684.h

    #Préhistoire #art_pariétal #Néandertal # Université_de_Southampton #D_L_Hoffmann #Paul_Pettitt #Université_de_Durham #J_Zilhão #Université_de_Barcelone #64000bp

  • Un pas de plus vers la reconnaissance de l’#anthropocène comme nouvelle ère géologique avec ce papier dans Science de l’Anthropocene Working Group.

    The Anthropocene is functionally and stratigraphically distinct from the Holocene
    http://www.sciencemag.org/content/351/6269/aad2622.full

    The appearance of manufactured materials in sediments, including aluminum, plastics, and concrete, coincides with global spikes in fallout radionuclides and particulates from fossil fuel combustion. Carbon, nitrogen, and phosphorus cycles have been substantially modified over the past century. Rates of sea-level rise and the extent of human perturbation of the climate system exceed Late Holocene changes. Biotic changes include species invasions worldwide and accelerating rates of extinction. These combined signals render the Anthropocene stratigraphically distinct from the Holocene and earlier epochs.

    ’Case is made’ for Anthropogenic Epoch
    http://www.bbc.com/news/science-environment-35259194

    “Within the Working Group - and we have 37 members - I think the majority of them now agree that we are living in an interval we should call the Anthropocene. There’s still some discussion as to whether it should be a formal or informal unit, but we’d like to have a specific definition. And a majority of the group are moving towards the mid-20th Century for the start of this new epoch.”

    [...]

    Ultimately it will be down to the International Commission on Stratigraphy to accept - or not - the “Anthropocene Epoch” as an additional unit in the official time scheme used to describe the planet’s 4.6 billion years of history.

  • Lotka-Volterra c’est fini
    http://www.sciencemag.org/content/349/6252/aac6284

    Across ecosystems globally, pyramid structure becomes consistently more bottom-heavy, and per capita production declines with increasing biomass. These two ecosystem-level patterns both follow power laws with near ¾ exponents and are shown to be robust to different methods and assumptions.

    #recherche #écologie #écosystèmes #proie-prédateur #loi_de_puissance

    (une version plus digeste (?) ici https://www.washingtonpost.com/news/energy-environment/wp/2015/09/03/researchers-may-have-just-stumbled-upon-a-mathematical-secret-to-how)

    • Bon je reconnais que mon titre est un peu #lol ; l’équation ne change pas, mais le modèle sous-jacent n’est pas confirmé, car il postule une proportionnalité (différée, ce qui fait tout son sel) entre le nombre de proies et celui des prédateurs.

    • Oui mais il peut aussi y avoir une situation de biomasse stable des prédateurs et des proies, dans laquelle ni la biomasse de l’un ni celle de l’autre groupe n’oscillent, sans pour autant invalider l’équation en question. La proportionnalité différée ne s’observe que dans les cas où ça oscille mais ce ne sont pas les seuls cas existants (heureusement, j’ai envie de dire, sinon quel bordel ce serait :-))

    • Pour le dire autrement : l’état d’équilibre d’un système L-V est un certain ratio (prédateurs = ratio x proies). Et ça ne peut pas être autrement, car il n’y a pas de dimension dans ces équations. Mais ce qu’observe cet article (sous réserve que les résumés soient fiables et que je les ai bien compris), c’est que la dimension compte.

  • Estimating the reproducibility of psychological science
    http://www.sciencemag.org/content/349/6251/aac4716

    One of the central goals in any scientific endeavor is to understand causality. Experiments that seek to demonstrate a cause/effect relation most often manipulate the postulated causal factor. Aarts et al. describe the replication of 100 experiments reported in papers published in 2008 in three high-ranking psychology journals. Assessing whether the replication and the original experiment yielded the same result according to several criteria, they find that about one-third to one-half of the original findings were also observed in the replication study.

    #Réplication #SHS

  • Sea Levels Could Rise At Least 20 Feet | Climate Central
    http://www.climatecentral.org/news/sea-levels-rise-20-feet-19211

    Even if world manages to limit global warming to 2°C — the target number for current climate negotiations — sea levels may still rise at least 6 meters (20 feet) above their current heights, radically reshaping the world’s coastline and affecting millions in the process.

    That finding comes from a new paper published on Thursday in Science that shows how high sea levels rose the last time carbon dioxide levels were this high.
    […]
    Even if we meet that 2°C target, in the past with those types of temperatures, we may be committing ourselves to this level of sea level rise in the long term,” Andrea Dutton, a geochemist at the University of Florida and one of the study’s co-authors, said. “The decisions we make now about where we want to be in 2100 commit us on a pathway where we can’t go back. Once these ice sheets start to melt, the changes become irreversible.

    L’article (du moins le résumé, le reste derrière #paywall)
    Sea-level rise due to polar ice-sheet mass loss during past warm periods
    http://www.sciencemag.org/content/349/6244/aaa4019

    OUTLOOK
    Our present climate is warming to a level associated with significant polar ice-sheet loss in the past, but a number of challenges remain to further constrain ice-sheet sensitivity to climate change using paleo–sea level records. Improving our understanding of rates of GMSL rise due to polar ice-mass loss is perhaps the most societally relevant information the paleorecord can provide, yet robust estimates of rates of GMSL rise associated with polar ice-sheet retreat and/or collapse remain a weakness in existing sea-level reconstructions. Improving existing magnitudes, rates, and sources of GMSL rise will require a better (global) distribution of sea-level reconstructions with high temporal resolution and precise elevations and should include sites close to present and former ice sheets. Translating such sea-level data into a robust GMSL signal demands integration with geophysical models, which in turn can be tested through improved spatial and temporal sampling of coastal records.

    Further development is needed to refine estimates of past sea level from geochemical proxies. In particular, paired oxygen isotope and Mg/Ca data are currently unable to provide confident, quantitative estimates of peak sea level during these past warm periods. In some GMSL reconstructions, polar ice-sheet retreat is inferred from the total GMSL budget, but identifying the specific ice-sheet sources is currently hindered by limited field evidence at high latitudes. Given the paucity of such data, emerging geochemical and geophysical techniques show promise for identifying the sectors of the ice sheets that were most vulnerable to collapse in the past and perhaps will be again in the future.


    Peak global mean temperature, atmospheric CO2, maximum global mean sea level (GMSL), and source(s) of meltwater.
    Light blue shading indicates uncertainty of GMSL maximum. Red pie charts over Greenland and Antarctica denote fraction (not location) of ice retreat.

  • Quelques canulars mémorables, pour la science - Arrêt sur images
    http://www.arretsurimages.net/articles/2015-06-02/Quelques-canulars-memorables-pour-la-science-id7770

    L’objectif déclaré de Bohannon : s’attaquer à la « pseudo-science » constituée par certaines études sur les régimes alimentaires, et à ses canaux de diffusion. Le journaliste-biologiste n’en est pas à son coup d’essai en matière de vraies-fausses études. En octobre 2013, il avait révélé comment il était parvenu à faire accepter la publication d’un faux article sur une méthode de lutte contre le cancer à 157 journaux (sur 304 sollicités).

    Rédigés en mauvais anglais, truffés d’erreurs et signés de pseudonymes générés automatiquement, les articles portaient sur une molécule présente dans le lichen, censée inhiber la croissance de cellules tumorales. John Bohannon ne les a pas soumis à n’importe quelles revues : il a ciblé les journaux scientifiques en libre-accès (en ligne). Ces derniers, nés en réponse au monopole des grands éditeurs scientifiques, sont l’objet d’un débat : côté pile, ils permettent à des lecteurs qui ne sauraient s’offrir les coûteux abonnement aux grandes revues (parfois plus de 4000 euros par an) d’avoir accès à des travaux de recherche, mais côté face, le système attire son lot d’entrepreneurs peu scrupuleux, qui font payer d’importantes sommes d’argent à de jeunes chercheurs en mal de publications, sans assurer de relecture par un comité de pairs. C’est sur ce second aspect que le canular de Bohannon a mis le doigt de façon spectaculaire.

    En plus d’un article (un vrai, cette fois), Bohannon a exposé son forfait dans une savoureuse carte interactive :

    liste des journaux selon l’outcome :
    http://www.sciencemag.org/content/342/6154/60/suppl/DC1
    papier :
    http://www.sciencemag.org/content/342/6154/60.full

    • Imagine a washing machine that destroys some of the items of clothing you put in it. Now imagine researchers employed by the company publishing a study that gives you a number — one in thirteen clothing items are destroyed by machines manufactured at a small plant which produces 4 percent of the devices the company produces. Now imagine the company also goes on to research how people donate their own clothes to charity, or don’t take care of their clothes as well as they should. The headline wouldn’t be: “It’s your fault that your clothes are destroyed.”

    • Third, and perhaps most important, Facebook is on a kick to declare that the news feed algorithm it creates, controls and changes all the time is some sort of independent force of nature or something that is merely responsive to you, without any other value embedded in its design. But in reality, the algorithm is a crucial part of Facebook’s business model.

      Last month at a journalism conference, Facebook’s director of news and media partnerships said, “It’s not that we control news feed, you control news feed by what you tell us that you’re interested in.” Before that, the 26-year-old engineer who heads the team that designs the news feed algorithm said, “We don’t want to have editorial judgment over the content that’s in your feed... You’re the best decider for the things that you care about.” The reality is far from that, of course, since Facebook decides what signals it allows (Can you “dislike” anything on Facebook? Nope), which ones it takes into account and how, and what it ultimately shows its 1.4 billion users.

      L’étude : http://www.sciencemag.org/content/348/6239/1130.abstract

    • La poule de la bulle de filtre et l’oeuf de l’éditorialisation algorithmique
      http://affordance.typepad.com//mon_weblog/2015/06/poule-bulle-de-filtre-oeuf-editorialisation-algorithmique.html

      La poule. Nous ne sommes donc heureusement pas complètement « prisonniers » de cette bulle algorithmique, nous avons donc encore la possibilité de garder l’initiative de nos choix, et il est de surcroît possible - tout au moins pour quelques aristocrates éclairés - de braconner en terre algorithmique.

      Et l’oeuf. A l’inverse et réciproquement, les algorithmes n’ont de cesse de nous proposer des choix « orientés » en fonction de critères que nous sommes loin de toujours maîtriser ; les mêmes algorithmes raisonnent par inférence sur la base de nos choix initiaux pour nous proposer des contenus et des choix qui finissent par rétro-agir avec nos propres choix jusqu’à pouvoir les influencer de manière parfois déterminante y compris à l’échelle d’un scrutin démocratique ; enfin, si le braconnage reste possible, il l’est dans des limites de plus en plus restreintes, de plus en plus complexes, et de plus en plus coûteuses cognitivement.

      La question de la bulle de filtre n’a pas pas davantage de réponse définitive que celle de savoir si un programme informatique (un algorithme) peut être « neutre » - il l’est par définition (c’est un programme) et il ne l’est pas par « application », puisque son itération produit un double effet de Feedback, feedback externe par rapport aux clics de l’utilisateur, et feedback interne par rapport aux ajustements faits en fonction desdits choix mais aussi par rapport aux « intentions » de programmation qui président à l’établissement de la finalité dudit algorithme (que choisit-on de retenir ou de ne pas retenir, que considère-t-on comme de l’info prioritaire, en fonction de quel critère, etc.).

      Une nouvelle fois donc, impossible de savoir qui de l’oeuf ou de la poule précède l’autre. Le principal problème reste entier et c’est celui de la diversité. Mais pas la diversité de nos choix ou de ceux qui nous sont proposés, la diversité des acteurs qui nous proposent ces choix au sein d’environnements contrôlés. Presse, radio, télé ... il y a des journaux « de gauche », d’autres « de droite », nous « savons » lesquels sont de gauche et lesquels de droite. Et surtout nous avons le choix. Il y a du choix. Il y a de la diversité.

  • Four of nine planetary boundaries now crossed
    http://www.pierrejoris.com/blog/?p=12737

    Four of nine planetary boundaries have now been crossed as a result of human activity, says an international team of 18 researchers in the journal Science. The four are: climate change, loss of biosphere integrity, land-system change, altered biogeochemical cycles. The scientists say that two of these, climate change and biosphere integrity, are “core boundaries” – significantly altering either of these would “drive the Earth System into a new state”. The team will present their findings in seven seminars at the World Economic Forum in Davos (21-25 January).

    L’article de Science (le résumé, le reste derrière #paywall)

    Planetary boundaries : Guiding human development on a changing planet
    http://www.sciencemag.org/content/early/2015/01/14/science.1259855

    The planetary boundaries framework defines a safe operating space for humanity based on the intrinsic biophysical processes that regulate the stability of the Earth System. Here, we revise and update the planetary boundaries framework, with a focus on the underpinning biophysical science, based on targeted input from expert research communities and on more general scientific advances over the past 5 years. Several of the boundaries now have a two-tier approach, reflecting the importance of cross-scale interactions and the regional-level heterogeneity of the processes that underpin the boundaries. Two core boundaries—climate change and biosphere integrity—have been identified, each of which has the potential on its own to drive the Earth System into a new state should they be substantially and persistently transgressed.

  • Genomes reveal start of Ebola outbreak

    http://www.sciencemag.org/content/345/6200/989.full

    When the young woman arrived at the Kenema Government Hospital in Sierra Leone in late May, she had high fever and had just miscarried. The hospital suspected she had contracted Lassa fever, because the viral disease is endemic in the region and often causes miscarriages. But Ebola virus disease, another hemorrhagic fever illness, had been spreading in neighboring Guinea for months, so when she began bleeding profusely, staff tested her for that virus as well. The results were positive, making her the first confirmed case of Ebola in Sierra Leone.

    The young woman, who eventually recovered, is now at the heart of a tragic but potentially important research tale. In a paper online this week in Science, a collaboration led by Stephen Gire and Pardis Sabeti of Harvard University and the Broad Institute in Cambridge, Massachusetts, report sequencing and analyzing the genomes of Ebola virus samples from 78 people in Sierra Leone who were diagnosed with Ebola between late May and mid-June, including the young woman who came to Kenema’s hospital. The 99 complete sequences—some patients were sampled more than once—provide insights into how the virus is changing during the outbreak, which could help improve current diagnostic tests and, in the long term, guide researchers working on vaccines and treatments.

    #ebola

  • World population stabilization unlikely this century
    http://www.sciencemag.org/content/early/2014/09/17/science.1257469

    Analysis of these data reveals that, contrary to previous literature, world population is unlikely to stop growing this century. There is an 80% probability that world population, now 7.2 billion, will increase to between 9.6 and 12.3 billion in 2100

    au lieu des prévisions précédentes à 9 milliards (désolé je n’ai pas accès au texte complet)
    #population

  • Study: Left alone with their thoughts, people choose electric shock
    http://www.latimes.com/science/sciencenow/la-sci-sn-people-alone-thoughts-mind-dislike-electric-shocks-20140703-story

    “But what is striking is that simply being alone with their own thoughts for 15 minutes was apparently so aversive that it drove many participants to self-administer an electric shock that they had earlier said they would pay to avoid."

    Just think: The challenges of the disengaged mind
    http://www.sciencemag.org/content/345/6192/75.abstract
    #concentration #solitude

  • Genomic surveillance elucidates #Ebola #virus origin and #transmission during the 2014 outbreak
    http://www.sciencemag.org/content/early/2014/08/27/science.1259657.full

    This West African variant likely diverged from Middle African lineages ~2004, crossed from Guinea to Sierra Leone in May 2014, and has exhibited sustained human-to-human transmission subsequently, with no evidence of additional zoonotic sources. Since many of the #mutations alter protein sequences and other biologically meaningful targets, they should be monitored for impact on diagnostics, vaccines, and therapies critical to outbreak response.

    Ebola virus mutating rapidly as it spreads
    http://www.nature.com/news/ebola-virus-mutating-rapidly-as-it-spreads-1.15777

    Further comparisons suggest that the virus that caused the outbreak separated from those that caused past Ebola outbreaks about 10 years ago. It had accumulated more than 395 mutations between that time and June, when the researchers collected the last samples included in today’s analysis.

    The virus amassed 50 mutations during its first month, the researchers found. They say there is no sign that any of these mutations have contributed to the unprecedented size of the outbreak by changing the characteristics of the Ebola virus — for instance, its ability to spread from person to person or to kill infected patients. But others are eager to examine these questions.

    And such risks rise as the virus continues to spread. “The longer we allow the outbreak to continue, the greater the opportunity the virus has to mutate, and it’s possible that it will mutate into a form that would be an even greater threat than it is right now,” says Charles Chiu, an infectious-disease physician at the University of California, San Francisco.

    Cinq coauteurs d’une étude sur Ebola ont été tués par le virus avant sa publication
    par Jean-Yves Nau,
    le 28 août 2014
    http://m.slate.fr/story/91505/cinq-coauteurs-etude-ebola-tues-virus

    C’est une publication sans précédent qui vient d’être mise en ligne sur le site de la revue américaine Science. Une double première. D’abord, parce qu’elle met en lumière la dynamique génétique intime des innombrables isolats du virus Ebola qui progressent actuellement en Afrique de l’Ouest. Ensuite, parce que cinq de ses signataires sont morts avant de voir leurs noms publiés dans la prestigieuse revue de l’American Association for Advancement of Sciences.

    Cinq morts sur cinquante-huit auteurs, cinq morts infectés par le virus contre lequel ils luttaient. L’article avait été adressé pour publication à la rédaction en chef de Science le 5 août. Après relectures par des pairs, il a été accepté le 21 août et est donc publié sept jours plus tard. Quatre auteurs sont morts avant sa rédaction finale, le cinquième pendant la relecture.

    Les cinquante-trois auteurs toujours vivants rendent hommage à leurs collègues en fin de publication :
    « In memoriam : de manière tragique, cinq des coauteurs, qui ont grandement contribué au maintien de la santé publique et à l’effort de recherche en Sierra Leone, ont contracté le virus Ebola durant leur travail et ont été vaincus par la maladie avant la publication de cette étude. Nous voulons honorer leur mémoire. »

    Ils avaient pour noms Mohamed Fullah, Mbalu Fonnie, Alex Moigboi, Alice Kovoma et Humarr Khan. Tous travaillaient à l’hôpital gouvernemental de Kenema, en Sierra Leone. (...)

    Ce travail a été mené sur 99 isolats de virus Ebola obtenus après des prélèvements de sang effectués chez 78 malades de Sierra Leone. Après une série d’analyses génomiques particulièrement sophistiquées effectuées en un temps record, la communauté scientifique internationale dispose, pour la première fois depuis la découverte du virus en 1976, de données sur les mécanismes de reproduction et de mutation du virus.

    Les chercheurs confirment pour la première fois avec des preuves moléculaires l’hypothèse avancée par des chercheurs français selon laquelle le virus Ebola qui sévissait jusqu’alors en Afrique centrale a divergé pour donner celui qui frappe aujourd’hui l’Afrique de l’Ouest –sans doute véhicule par des #chauves-souris frugivores porteuses saines. Ils confirment également qu’un seul type de virus est à l’origine de l’épidémie actuelle, qui a émergé fin 2013 en Guinée.

    Report : Dogs Eating Dead Bodies Of Ebola Victims On Liberian Streets
    http://atlanta.cbslocal.com/2014/08/27/report-dogs-eating-dead-bodies-of-ebola-victims-on-liberian-street

    The New Dawn reports that the Liberian government buried bodies of those suspected to have died from Ebola a few weeks ago in Johnsonville Township, outside of Monrovia. A number of dogs were reportedly seen pulling the bodies out of the graves and eating the remains.

    • Le résumé de l’article de Science

      Varying planetary heat sink led to global-warming slowdown and acceleration
      http://www.sciencemag.org/content/345/6199/897.abstract

      A vacillating global heat sink at intermediate ocean depths is associated with different climate regimes of surface warming under anthropogenic forcing: The latter part of the 20th century saw rapid global warming as more heat stayed near the surface. In the 21st century, surface warming slowed as more heat moved into deeper oceans. In situ and reanalyzed data are used to trace the pathways of ocean heat uptake. In addition to the shallow La Niña–like patterns in the Pacific that were the previous focus, we found that the slowdown is mainly caused by heat transported to deeper layers in the Atlantic and the Southern oceans, initiated by a recurrent salinity anomaly in the subpolar North Atlantic. Cooling periods associated with the latter deeper heat-sequestration mechanism historically lasted 20 to 35 years.

      Une visualisation du stockage d’énergie


      illustrant cette courte présentation

      Earth’s missing heat may be hiding in the deep Atlantic | Science/AAAS | News
      http://news.sciencemag.org/climate/2014/08/earths-missing-heat-may-be-hiding-deep-atlantic

      The work draws on tens of millions of ocean temperature and salinity measurements taken globally by buoys, floats, and ships since 1970. Covering 24 depths from the sea surface down to 1500 meters, the data suggest that over the last decade or so the Atlantic has been absorbing heat (red in the graphic above) that would have otherwise warmed the surface. Over the past 14 years, the authors write, water below 300 meters in the North and South Atlantic oceans has stored more energy than the rest of the global oceans combined.

      L’édito de Science sur le sujet qui remet en contexte, présente les autres hypothèses sur le rôle de la circulation océanique et rappelle qu’il ne s’agit que d’une pause apparente, puisque l’accumulation de chaleur se poursuit, mais hors de notre vue.

      Pas sûr que cela suffise à neutraliser les climato-sceptiques…

      Is Atlantic holding Earth’s missing heat ?
      http://www.sciencemag.org/content/345/6199/860.summary

      Armchair detectives might call it the case of Earth’s missing heat: Why have average global surface air temperatures remained essentially steady since 2000, even as greenhouse gases have continued to accumulate in the atmosphere? The suspects include changes in atmospheric water vapor, a strong greenhouse gas, or the noxious sunshade of haze emanating from factories. Others believe the culprit is the mighty Pacific Ocean, which has been sending vast slugs of cold bottom water to the surface. But two fresh investigations finger a new suspect: the Atlantic Ocean. One study, in this issue of Science, presents sea temperature data implying that most of the missing heat has been stored deep in the Atlantic. The other, published online in Nature Climate Change, suggests a warming Atlantic is abetting the Pacific by driving wind patterns that help that ocean cool the atmosphere. But some climate specialists remain skeptical. In a third recent paper, also published online in Nature Climate Change, other researchers argue that the Pacific remains the kingpin. One reason some scientists remain convinced the Pacific is behind the hiatus is a measured speedup in trade winds that drive a massive upwelling of cold water in the eastern Pacific. But there, too, the Atlantic may be responsible, modeling experiments suggest. A consensus about what has put global warming on pause may be years away, but one scientist says the recent papers confirm that Earth’s warming has continued during the hiatus, at least in the ocean depths, if not in the air.

  • An Infographic That Maps 2,000 Years of Cultural History in 5 Minutes | Design | WIRED

    http://www.wired.com/2014/08/an-infographic-that-maps-2600-years-of-cultural-history-in-5-minutes

    Fascinant. On se demande quoi faire en cartographie après avoir vu ça...

    https://www.youtube.com/watch?v=4gIhRkCcD4U

    Ah, Hollywood. Our glowing beacon of modern hope and dreams. But before Hollywood, there was New York, and before New York there was Berlin, Paris, Rome and Greece. History’s most creative people have always flocked to cultural and intellectual hubs, and now, thanks to an amazing visualization from researchers at the University of Texas at Dallas, we can see how that migration has changed over time.

    Last week in the journal Science, the researchers (led by University of Texas at Dallas art historian Maximilian Schich) published a study that looked at the cultural history of Europe and North America by mapping the birth and deaths of more than 150,000 notable figures—including everyone from Leonardo Da Vinci to Ernest Hemingway. That data was turned into an amazing animated infographic that looks strikingly similar to the illustrated flight paths you find in the back of your inflight magazine. Blue dots indicate a birth, red ones means death.

    #cartographie #visualisation #culture #cartographie_animée

  • Plus d’humains, moins d’invertébrés
    http://www.lapresse.ca/actualites/sciences/201407/24/01-4786524-plus-dhumains-moins-dinvertebres.php

    Face au quasi-doublement du nombre d’êtres humains sur la Terre depuis 40 ans, le nombre d’#insectes, de vers et de crustacés a baissé de 45%, estiment des chercheurs dans une étude parue jeudi dans la revue Science.

    Les invertébrés —tous les #animaux qui ne possèdent pas de colonne vertébrale— sont des êtres indispensables à la Terre : ils pollinisent les cultures, réduisent les insectes nuisibles, filtrent l’eau et nourrissent le sol de nutriments.

    Les chercheurs estiment que 322 espèces de vertébrés ont disparu dans les cinq derniers siècles. Les espèces restantes comptent en outre 25% d’individus en moins.

    « Nous avons été très surpris de découvrir que les pertes chez les invertébrés étaient similaires à celles d’animaux plus grands, car nous pensions jusqu’à présent que les invertébrés étaient plus résistants », a expliqué Ben Collen, de l’University College London, coauteur de l’étude.

    Deux facteurs contribuent à la disparition des invertébrés, selon les chercheurs : la perte d’habitat et le #changement_climatique.

    Une autre étude publiée dans le même numéro de Science décrit un rapport de cause à effet entre la disparition d’espèces animales et l’augmentation des #conflits, du crime organisé et de l’exploitation des enfants à l’échelle mondiale.

    La destruction d’emplois et la pénurie alimentaire pourraient provoquer directement une hausse du trafic d’êtres humains, selon cette étude menée par des chercheurs de l’Université de Californie à Berkeley.

    « Cet article décrit le déclin de la faune comme une source, et non un symptôme, de conflits sociaux », explique l’auteur principal, le professeur Justin Brashares.

    « Des milliards de gens dépendent directement et indirectement des ressources sauvages de viande pour leurs revenus et leur subsistance, et cette ressource diminue », dit-il.

    À titre d’exemples, le chercheur relève que les activités de piraterie au large de la Somalie ont pour origine un conflit sur les droits de pêche.

    Les deux papiers :
    Defaunation in the #Anthropocene
    http://www.sciencemag.org/content/345/6195/401
    Wildlife decline and social conflict
    http://www.sciencemag.org/content/345/6195/376

    #biodiversité

  • We can’t count on plants to slow down global warming
    http://www.theguardian.com/environment/climate-consensus-97-per-cent/2014/may/09/cant-count-on-plants-slowing-global-warming

    The authors note that many experiments have shown the increased CO2 usually helps stimulate photosynthesis and plant growth. Some of this extra CO2 ends up in the soils where it is unable to participate as a greenhouse gas.

    The current authors went a step further though. They asked what happens to the carbon after it is in the soils. We know that microbes decompose soil matter and thereby release the carbon back to the air. Will this process increase, decrease, or stay the same as the climate warms and climate change progresses? It is important because soil stocks (the amount of carbon contained in soil) is determined by a balance between the influx and outflux of carbon.

    The authors found that increased CO2 in the atmosphere actually increased the outflux of carbon dioxide from the soils. That is, it increased the rate of decomposition. In the long run, the increases in influx and outflux will essentially balance out. This suggests that there will be little help from the biosphere for us humans – plants will not take up our emissions.

    The authors have two competing hypotheses behind the physical mechanisms that drive the decomposition. They told me that it is possible the plants close their stomata (the tiny pores which allow water and CO2 to pass into and out of leaves). As the stomata close, the soils become wetter and microbial activity increases. The authors also think that as atmospheric CO2 increases, soil microbes respond by decomposing older soil carbon. They call this a “priming effect” which is a natural buffering mechanism that slows carbon accumulation in soils.

    Author Dr. Bruce Hungate from the Center for Ecosystem Science and Society told me,

    These results add to an increasingly clear picture that natural carbon sinks are finite. In particular, the soil carbon sink driven by rising CO2 concentrations has probably been overestimated. Natural land ecosystems are unlikely to sequester as much carbon as we had hoped. We should not expect nature to mop up the atmosphere for us. We have long thought soils to be a stable, safe place to store carbon, but our results show that soil carbon is not as stable as we previously thought .”

    This all goes to show that it is really up to us humans, the emitters of greenhouse gases to take the lead on fixing the problem we started. The earlier we take action, the easier it will be.

    http://www.sciencemag.org/content/344/6183/508.abstract

    #climat #carbone #plantes

  • La #soundscape_ecology, ou étudier un écosystème par le son.

    Eavesdropping on Ecosystems
    http://www.sciencemag.org/content/343/6173/834.full

    Sueur and his colleagues weren’t interested in exactly which species were calling. Instead, he says they wanted “to take a global measure of the acoustic output of the community.” Their goal was an algorithm that could boil hours of acoustic data down to a single number describing how an ecosystem’s acoustic energy is distributed across the frequency spectrum and over time.

    [...]

    The boom in sound-recording studies poses a challenge familiar in other fields: a glut of data. Pijanowsky’s lab alone has amassed about 85 terabytes of sound—more than 100,000 hours—in just 5 years. “This is a science that’s plagued by the big data challenges that you see in, say, genetics,” he says. Many researchers already have libraries of field recordings that, if played in real time, would be longer than their careers. “We know that we’re not going to be able to listen to it all,” says computer scientist Michael Towsey of the Queensland University of Technology in Brisbane, Australia.

    To get around that problem, he’s developing ways to navigate soundscapes by sight, creating color-coded spectrograms that trained eyes can interpret at a glance. Towsey describes the visualizations as “#acoustic_weather” charts. Some show how the spectrum of sounds shifts over a single day, while others assemble daily records into long-term snapshots to capture changes between seasons or years. That’s akin to studying the “#acoustic_climate,” he notes. And “when we start thinking about the acoustic climate, then we can start thinking about acoustic climate change.” Year-to-year comparisons could eventually highlight subtle and potentially problematic changes, he predicts, such as changing rain patterns or shifts in bird activity.

    Computer scientist Michael Towsey combines 8 months of continuous recordings at a research station in Brisbane, Australia, into a single image. Colors indicate different acoustic indices. At dawn (left curve), a morning bird chorus (blue) is obvious during the Australian spring and early summer (October through December), but fades later in the year. Horizontal green streaks indicate heavy rainfall in January and February. At dusk (right curve), cicada activity is evident in the spring and summer months (green); by winter, the night is increasingly silent.

    #ecologie #sons #field_recording #biodiversite #eco-acoustique

  • « A riderless bicycle can automatically steer itself so as to recover from falls. The common view is that this self-steering is caused by gyroscopic precession of the front wheel, or by the wheel contact trailing like a caster behind the steer axis. We show that neither effect is necessary for self-stability. »

    Résumé : la science ne sait toujours pas pourquoi les bicyclettes ne tombent pas.

    http://www.sciencemag.org/content/332/6027/339

    #physique #vélo

  • La #forêt amazonienne inventoriée pour la première fois
    http://lemonde.fr/planete/article/2013/10/17/la-foret-amazonienne-inventoriee-pour-la-premiere-fois_3497885_3244.html

    Difficile de se figurer ce que représente l’Amazonie, plus vaste aire de forêt tropicale humide et plus grand réservoir de biodiversité au monde, qui s’étend sur près de 6 millions de km2 et sur neuf pays. Pour la première fois, une équipe internationale de chercheurs a dressé l’inventaire des arbres qui peuplent ce bassin, afin d’en connaître la diversité, la rareté et la richesse, dans une étude publiée dans la revue Science, vendredi 18 octobre.

    Il en résulte que la forêt amazonienne est composée de près de 390 milliards d’arbres appartenant à environ 16 000 espèces différentes. Parmi elles, 227 (soit 1,4 % du total) sont hyper dominantes et totalisent plus de la moitié des individus, alors que les 11 000 essences rares décomptées représentent seulement 0,12 % des spécimens.

    http://www.sciencemag.org/content/342/6156/1243092

    « On a cartographié chaque parcelle, étudié le sol, mesuré la hauteur et la circonférence de chaque arbre et prélevé des échantillons de bois pour les analyser en laboratoire », décrit Daniel Sabatier, chercheur spécialiste de la forêt amazonienne à l’Institut de recherche pour le développement, qui a participé à l’étude. Les données ont été regroupées dans le réseau international Amazon Tree Diversity Network. Une extrapolation – grâce à un modèle de distribution des abondances – a finalement permis d’obtenir des statistiques sur l’ensemble du bassin.

    http://testweb.science.uu.nl/Amazon/atdn


    #Amazonie #inventaire #biodiversité

  • Who’s Afraid of Peer Review ? — John Bohannon (Science)
    http://www.sciencemag.org/content/342/6154/60.full

    est-ce facile de publier dans des journaux scientifiques ? Un chercheur fabrique des articles faux (de façon flagrante), les envoie à 400 journaux, et regarde qui accepte de les publier (moyennant finances).

    Journals published by Elsevier, Wolters Kluwer, and Sage all accepted my bogus paper. (...) The Elsevier journal that accepted the paper, Drug Invention Today, is not actually owned by Elsevier, says Tom Reller, vice president for Elsevier global corporate relations: “We publish it for someone else.”

    #publication #open_access #recherche #spam #flagrant_délit

    • OPEN ACCESS : DU RÊVE AU CAUCHEMAR

      http://sciences.blogs.liberation.fr/home/2013/10/open-access-du-rêve-au-cauchemar-.html

      Or, les revues en accès libre ont aussi fait l’objet d’une prédation capitaliste. Des sociétés privées ont fondé en quelques années des milliers de revues. La liste du DOAJ (annuaire des revues en open access) affiche déjà plus de 9.900 revues ; dont 1000 enregistrées en 2012. Elles ont constitué des comités éditoriaux et recruté des « reviewers » en inondant de spam des milliers de chercheurs à travers le monde. Ces revues n’ont en réalité, malgré les proclamations, aucune qualité scientifique, et peuvent publier absolument n’importe quoi : de la science non seulement médiocre, mais pathologique, mensongère, voire des purs canulars comme vient de le prouver Science. Elles singent les revues scientifiques classiques - et souvent leurs noms avec des American et des European cachant des adresses en Turquie ou au Pakistan, le plus gros paquet de revues testées se trouvant en Inde, suivi... des Etats-Unis où le profit final est souvent retrouvé - avec comité éditorial, relecteurs et la qualité scientifique en bandoulière. Or, 45% des revues de cette liste du DOAJ auxquelles le papier bidon a été envoyé l’ont accepté.

    • Open access publishing hoax: what Science magazine got wrong | Higher Education Network | Guardian Professional
      http://www.theguardian.com/higher-education-network/blog/2013/oct/04/science-hoax-peer-review-open-access

      In Norway, where I work, there is a national committee charged with sorting out bad journals – open access and traditional alike. And, yes, because of author payment, that committee sees a proliferation of illegitimate open access journals. But, again, that is because of author payment, not because the results of research are being made freely available.